INVITE-ONLY SCRIPT
已更新 MVolume‴ | Multi Volume Indicator‴

Hello Traders!
This simple but yet efficient indicator view presents the Volume with the following benefits:
1. both buyer and seller volume are shown separately and above zero line, this way its possible to see which side is dominant;
2. both buyer and seller volume are shown separately, with buyers above the zero line and sellers bellow the zero line. The dominant side is shown in its darker color version;
3. 20 period Moving Average line is calculated separately and plotted for each side (buyer/seller);
4. 50% of the 20 period Moving Average line is calculated separately and plotted for each side (buyer/seller);
5. possibility to apply Directional OHLC values to enhance the buyer/seller movement interpretation.
p.s.: the chart presents two MVol indicators to let you see the different possible views.
To request access to this invite-only script, please DM me.
版本注释
Just minor adjustment to the INPUT panel.版本注释
What's New- runs on Pine 4
- size arrow for buyer (blue) and seller (red) bar slice: show you if the current slices are greater or not if compared to the previous bar slices
- provides buyer and seller slice percentage and average number of trades
版本注释
Now you are allowed to visualize the accumulated volume and you define the best period to view it for you asset.This is a game changing for your analysis!
版本注释
(updating the right chart)版本注释
(one more chart update, now with description)版本注释
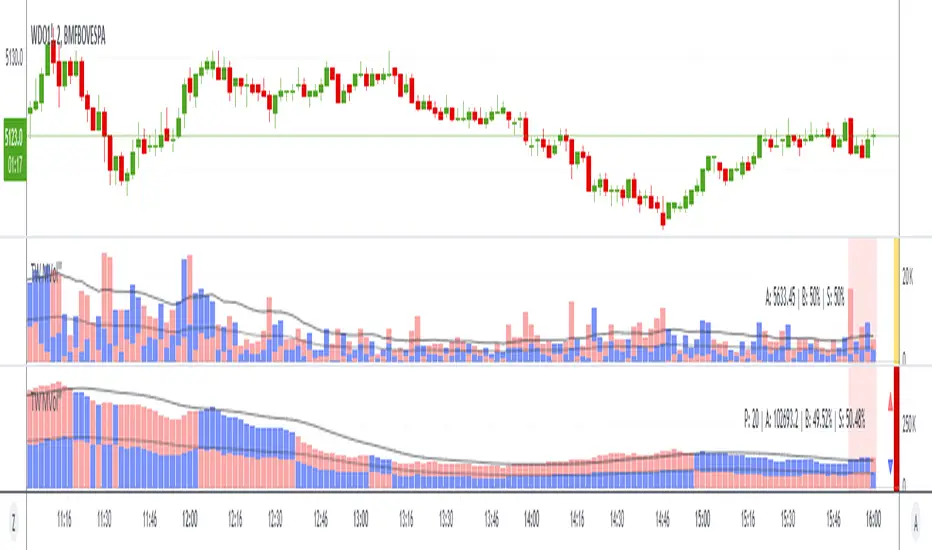
Now you can plot the Volume with a Accumulated format and you define the period to be considered.Look at the image, the:
1. top MVol: is the regular volume you are already familiar, where the buy and sell partitions of each volume bar are shown separately;
2. bottom MVol: is the 5 period Accumulated Volume. Notice how the buy blue bars takes controle during a certain period of time and than the sell red bars take over during the next time period of time.
Hope you like it!
版本注释
Just minor but important updates:1. now the volume can be ploted with an accumulated format;
2. it's possible to choose the desired period to present accumulated volume. The pre-defined period values are: 6, 20, 72, 100, 200;
3. there's a field to enter your prefered accumulated volume period.
仅限邀请脚本
只有作者授权的用户才能访问此脚本。您需要申请并获得使用许可。通常情况下,付款后即可获得许可。更多详情,请按照下方作者的说明操作,或直接联系MarceloTorres。
TradingView不建议您付费购买或使用任何脚本,除非您完全信任其作者并了解其工作原理。您也可以在我们的社区脚本找到免费的开源替代方案。
作者的说明
To have access to this indicator, please DM me.
Don't contact me in the comment area.
TRADEWISER | Marcelo Torres
marcelo@tradewiser.pro
Vídeo-Análise completa diária no YouTube:
youtube.com/c/TradeWiserPro
Curso/AE
CursoAE.TradeWiser.pro
@TradeWiserPro
Telegram, Twitter, Facebook, LinkedIn, Instagram
marcelo@tradewiser.pro
Vídeo-Análise completa diária no YouTube:
youtube.com/c/TradeWiserPro
Curso/AE
CursoAE.TradeWiser.pro
@TradeWiserPro
Telegram, Twitter, Facebook, LinkedIn, Instagram
免责声明
这些信息和出版物并非旨在提供,也不构成TradingView提供或认可的任何形式的财务、投资、交易或其他类型的建议或推荐。请阅读使用条款了解更多信息。