OPEN-SOURCE SCRIPT
Cumulative Ease of Movement
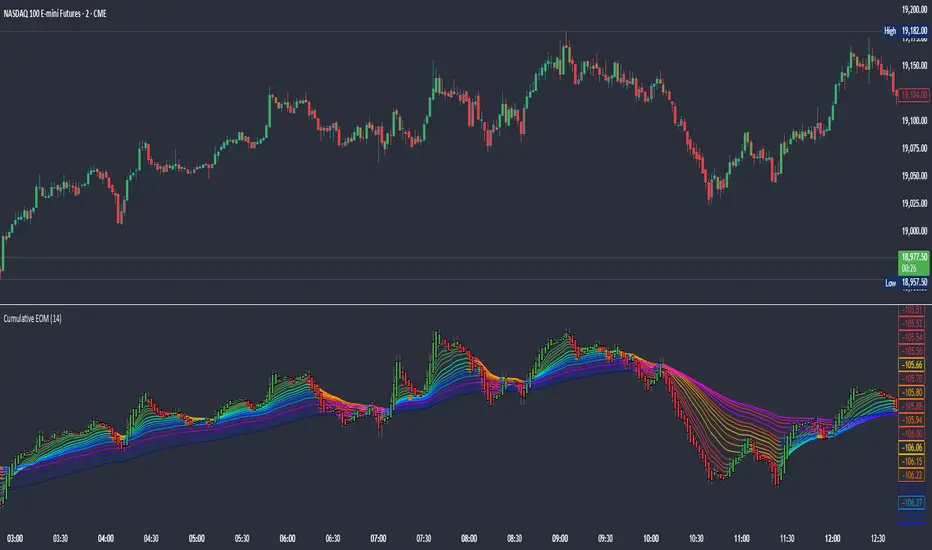
This indicator visualizes Cumulative Ease of Movement (EOM) to assess the efficiency of price movement relative to volume and volatility. Instead of analysing individual bars, this tool accumulates EOM values over time, helping you identify persistent buying or selling pressure.
The original Ease of Movement created by Richard Arms is an oscillator:
EOM = ((Midpoint Move) / Box Ratio)
Midpoint Move = ((High + Low)/2) - ((High[1] + Low[1])/2)
Box Ratio = Volume / (High - Low)
this indicator simply accumulates those values over time.
It incorporates a full Guppy Multiple Moving Average (GMMA) framework applied to the cumulative EOM curve, highlighting trend strength, transition zones, and slow/fast compression. Optional bar colouring and candle overlays reflect EOM direction and allow visual clarity during trending or congested conditions.
To facilitate the interpretation of the cumulative EOM, the GMMA and the Heikin Ashi smooths the signals, but the EOM itself is not smoothed.
Features
- Cumulative EOM plot (toggleable)
- GMMA overlays: short, medium, long-term
- Optional bar colouring based on EOM trend
- Heikin Ashi-style smoothing option
- EOM rendered as candle plot for momentum interpretation
Use Cases
- Identify trend strength and consistency through EOM slope + GMMA expansion
- Spot absorption and exhaustion zones when price pushes but cumulative EOM diverges
- Detect transitions when GMMA layers begin to compress and flip
- Validate breakout efficiency with strong EOM continuation
The Cumulative Ease of Movement (EOM) is designed to help traders follow the path of least resistance in the market by tracking whether price is moving efficiently with or against volume over time.
Rather than focusing on isolated bar-by-bar effort, it accumulates directional bias, allowing you to see whether buying or selling pressure is sustained and aligned with ease — or whether market moves are inefficient and likely to fade.
If you do not wish to use candles, or heikin ashi, you can enable the Cumulative EOM line and disable the candles.
开源脚本
秉承TradingView的精神,该脚本的作者将其开源,以便交易者可以查看和验证其功能。向作者致敬!您可以免费使用该脚本,但请记住,重新发布代码须遵守我们的网站规则。
免责声明
这些信息和出版物并非旨在提供,也不构成TradingView提供或认可的任何形式的财务、投资、交易或其他类型的建议或推荐。请阅读使用条款了解更多信息。
开源脚本
秉承TradingView的精神,该脚本的作者将其开源,以便交易者可以查看和验证其功能。向作者致敬!您可以免费使用该脚本,但请记住,重新发布代码须遵守我们的网站规则。
免责声明
这些信息和出版物并非旨在提供,也不构成TradingView提供或认可的任何形式的财务、投资、交易或其他类型的建议或推荐。请阅读使用条款了解更多信息。