OPEN-SOURCE SCRIPT
[boitl] Trendfilter
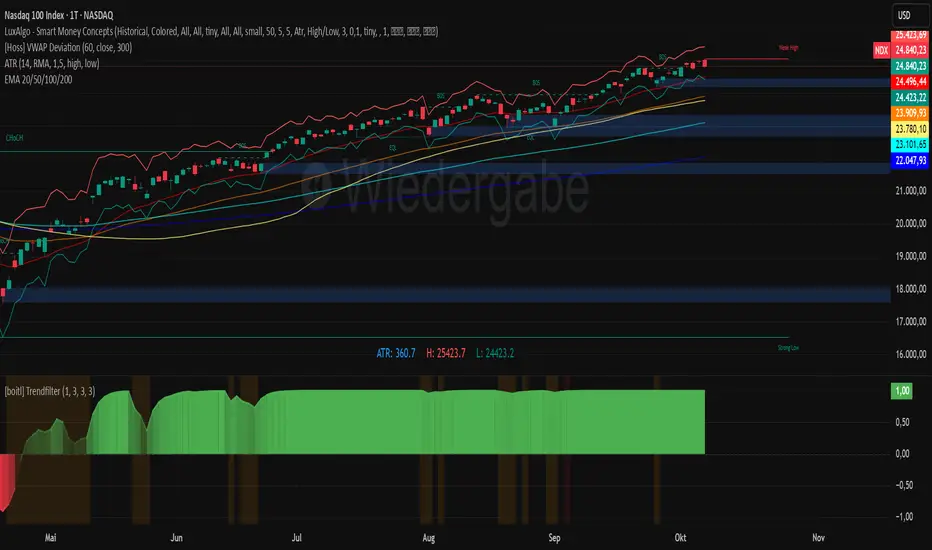
🧭 Trend Filter – Curve View (1D / 1H + M15 Check)
A multi-timeframe trend filter that blends daily, hourly, and 15-minute data into a smooth, color-coded curve displayed in a separate panel.
It visualizes both trend direction and strength while accounting for overextension, providing a reliable “context indicator” for entries and filters.
🔍 Concept
The indicator evaluates three timeframes:
1D (Daily) → SMA200 for long-term trend bias
1H (Hourly) → EMA50 for medium-term confirmation
15M (Intraday) → EMA20 + ATR to detect overextension or mean reversion zones
It computes a continuous trend score between −1 and +1:
+1 → Strong bullish alignment (D1 & H1 both up)
−1 → Strong bearish alignment (D1 & H1 both down)
≈ 0 → Neutral, conflicting, or overextended conditions
The score is smoothed and normalized for a clean visual curve —
green for bullish, red for bearish, with dynamic transparency based on strength.
⚙️ Logic Overview
Timeframe Indicator Purpose
1D SMA200 Long-term trend direction
1H EMA50 Medium-term confirmation
15M EMA20 + ATR Overextension control
Alignment between D1 and H1 defines clear trend bias
Conflicts between them reduce the trend score
M15 overextension (price far from EMA20) softens the signal further
The result is a responsive trend-strength oscillator, ideal for multi-timeframe setups.
🧩 Use Cases
As a trend filter for strategies (e.g. allow entries only if score > 0.3 or < −0.3)
As a visual confirmation of higher-timeframe direction
To avoid trades during conflict or exhaustion
💡 Visualization
Single curve (area plot):
Green = bullish bias
Red = bearish bias
Transparency increases with weaker trend
Background colors:
🟠 Orange → D1/H1 conflict
🔴 Light red → M15 overextension active
Optional: binary alignment line (+1 / 0 / −1) for simplified display
⚙️ Parameters
Proximity to EMA20 (M15) = X×ATR → defines “near” condition
Overextension threshold = X×ATR → sets exhaustion boundary
EMA smoothing → reduces noise for a smoother score
Toggle overextension impact on/off
开源脚本
秉承TradingView的精神,该脚本的作者将其开源,以便交易者可以查看和验证其功能。向作者致敬!您可以免费使用该脚本,但请记住,重新发布代码须遵守我们的网站规则。
免责声明
这些信息和出版物并非旨在提供,也不构成TradingView提供或认可的任何形式的财务、投资、交易或其他类型的建议或推荐。请阅读使用条款了解更多信息。
免责声明
这些信息和出版物并非旨在提供,也不构成TradingView提供或认可的任何形式的财务、投资、交易或其他类型的建议或推荐。请阅读使用条款了解更多信息。