PROTECTED SOURCE SCRIPT
已更新 Buy/Sell Volume Details
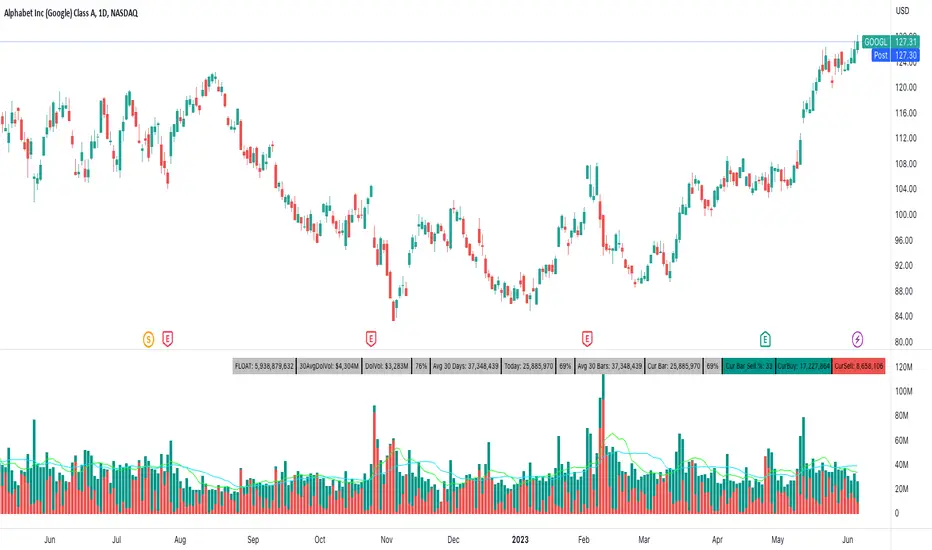
This attempts to color buy and sell volume of each bar.
In addition to coloring the bars, the table shows average volumes for the past 30 days, current volume for the day, current bar volume, the float of the ticker, and dollar volume for the day and average 30 days. You can also plot a fast and slow moving average of volume.
In addition to coloring the bars, the table shows average volumes for the past 30 days, current volume for the day, current bar volume, the float of the ticker, and dollar volume for the day and average 30 days. You can also plot a fast and slow moving average of volume.
版本注释
- Enhanced the code to be. more efficient when calculating the averages
- Added the ability to select the look back period. The default is 30 days but you can now change how far back you want the averages to take into account.
版本注释
- Added buy and sell volume cells that can be toggled on/off
受保护脚本
此脚本以闭源形式发布。 但是,您可以自由使用它,没有任何限制 — 在此处了解更多信息。
免责声明
这些信息和出版物并不意味着也不构成TradingView提供或认可的金融、投资、交易或其它类型的建议或背书。请在使用条款阅读更多信息。
免责声明
这些信息和出版物并不意味着也不构成TradingView提供或认可的金融、投资、交易或其它类型的建议或背书。请在使用条款阅读更多信息。