OPEN-SOURCE SCRIPT
已更新 Trend Indicator with RSI and Fibbonacci Band 0.702 crossings
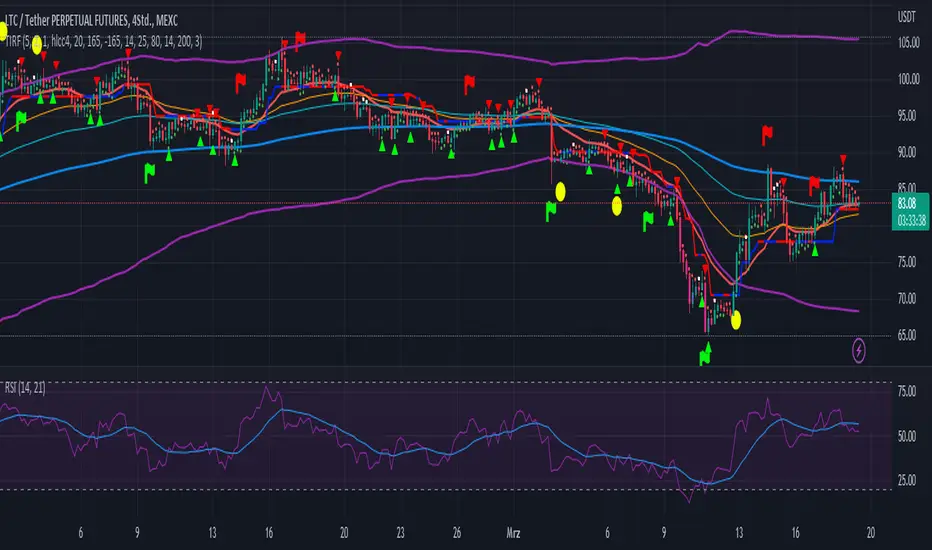
Today we have a new Indicator set, which I created using inspiration from the Trend Magic Indicator from KivancOzbilgic and adding several new aspects to it and a slightly modified calculation of the trend indicator itself.
You can change the inputs by changing the pre set values in the settings, but I found the current settings quite accurate. Feel free to experiment to fine tune the indicators.
Here are the details of the script:
Trend indicated within candles and as a line
- bullish and bearish trends are now also indicated within the candle based on the CCI calculation.
- Bullish is indicated by a green circle below the candle or as one may call it a "dot"
- bearish trend is indicated by a red circle above the candle
Entry Signal based on RSI crossing its EMA
- my motivation was to have a clearer entry signal besides highlighting a trend, which can not really be used to identify a good entry but to give confidence or when loosing trend to give an exit signal.
- after studiying the RSI and how it works together with its EMA it looks quite interesting as an entry or exit signal. But be cautios if the EMA and RSI values are moving in a narrow area we get a lot of crosses and therefore signals which should rather be ignored rather to be act on. So the the range where the cross happens is also quite important. But this aspect is not yet reflected as a rule/ logic.
But I am thinking of adding something.. or alternativly best to switch to another timeframe to get some better data
RSI overbought and oversold as Diamonds
- I also added key indications of oversold or overbought as Blue and Pink diamonds, can be considered as additional information to maybe identify a short term top or bottom.. but its not very accurate.
Entry signal based on crossing Fibbonachi Band 0.702
- So far the 0.702 seems to be quite an interesting retracement level which seems to be met a lot of times
- based on the assumption the price will evantually hit the 0.702 either direction I wanted to get a signal when this happens
- BUT! a big but, unfortunalty the Fibbonachi bands tend to bloat up in case of high volatility so it is not easy to find the crossing on higher timeframes
Here are the standard value which I found quite accurate for the assets I use this indicator set:
CCI Period = 5
ATR Multiplier = 1
ATR Period = 1
Source = High Low Close (hlc3 average value of the candle
Here the inputs used for the RSI Crossing signal (here you should play around a little to see which entry would have been best..)
RSI Length = 14
RSI Oversold = 25 (to be used for the "golden" entry signal based on the FBB crossing)
RSI Overbought = 80 (to be used for the "golden" entry signal based on the FBB crossing)
RSI Moving Average Length
In future versions I will add options to activate or deactive some of the plotting and espacially this golden dot when the fibbonachi band is being crossed needs some fine tuning..
And lets see if there is a way to fix the bloating of those bands..
版本注释
I made a mistake in the Fibbonacci Crossing at its 0.702 retracement.It was bascially a mix up, for the upper crossing it needs to be a "crossunder" calculation and not a "crossover" and the same for the down crossing, where it should have be a "crossover" instead of "crossunder" calculation.
Now is is correct as intended. But be carefull with those "Golden entries" use multiple timeframes or else you gonna get cut by the falling knife..
版本注释
- Alert options for the RSI crossing and a neutral trend value has been added--> now you can set up alert notifications properly! At least for the main signal which is the RSI crossings and optional is the neutral trend indication
- I have added a neutral trend indication as a white dot, you can change the color in the code (see plotting section) if you dont use the dark version of TradingView
- I also changed the oversold and overbought plottings from diamonds to bar colorings.
- I deactivated the 702 crossing circles as those are not good entry signals.. you can activate their plotting by removing the // in the plotting section
版本注释
Bug fixes and clearer descriptions for the alert notifications as well as more popping colors of the RSI indicatorNEW
- CCI indicator for bearisch and bullish signals as green and red diamonds
- also includes prototype for the strategy (inactive)
版本注释
- clear labels for every Style plottings- every indicator has now its alert signal
- Changed the plotting style of the CCI signals to flags just to have it look differently..
版本注释
- added EMA (20, 50, 100, 200)- missed some plot titles (e.g. Trend line, RSI overbought/ oversold bar coloring..
开源脚本
秉承TradingView的精神,该脚本的作者将其开源,以便交易者可以查看和验证其功能。向作者致敬!您可以免费使用该脚本,但请记住,重新发布代码须遵守我们的网站规则。
免责声明
这些信息和出版物并非旨在提供,也不构成TradingView提供或认可的任何形式的财务、投资、交易或其他类型的建议或推荐。请阅读使用条款了解更多信息。
免责声明
这些信息和出版物并非旨在提供,也不构成TradingView提供或认可的任何形式的财务、投资、交易或其他类型的建议或推荐。请阅读使用条款了解更多信息。