INVITE-ONLY SCRIPT
已更新 AT - Reverse Mean Log Returns - Coder Wolves
Reverse Mean Log Returns (RMLR) indicator
Here at Alpha Trading, we create indicators that are based on Volatility, Probability and Statistics. We always add our own secret sauce, to turn mathematical principles into indicators that are tradeable. If you have been here for a while, or even if you are new, you have most likely heard us talk about Returns in our other indicators such as the Wolfsbane, RMS Z-Score or some of our returns based oscillators.
Theory
Log Returns of Price are commonly used to normalize price action. In contrast to price which never reverts to the mean, log returns are mean reverting.
In addition we assume that log returns are normally distributed, whereas price is never normally distributed. Price is log normal distributed, therefore it is wrong to calculate standard deviation directly on price, like in Bollinger bands. But for the normal distributed log returns it is mathematically correct and can be used to find extremes of the market.
Why did we create the RMLR
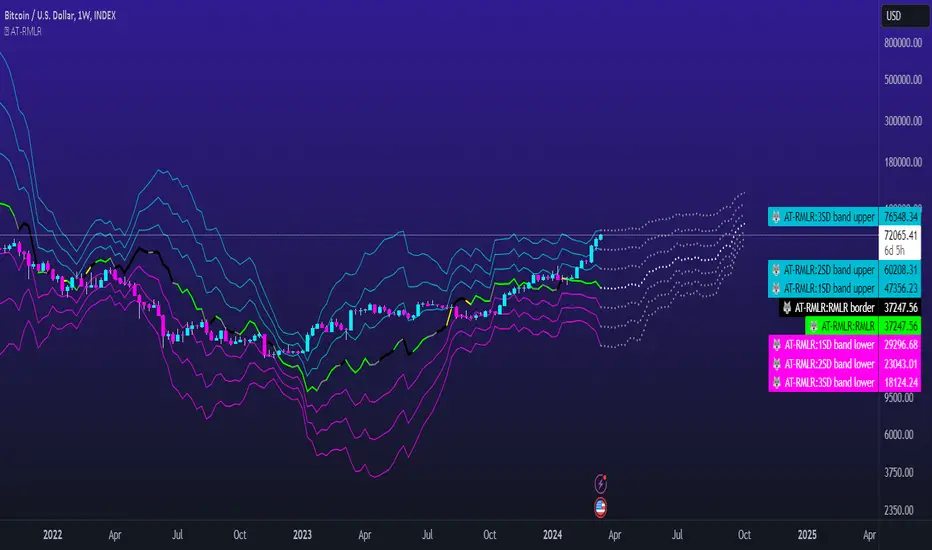
What if we could see that mean (where the log returns will reverse) and market extremes (multiples of standard deviations) on a price scale? Well, that's our Reverse Mean Log Returns (RMLR) indicator.
RMLR shows the Reverse Mean of Log Returns and their first, second and third standard deviation. These levels represent the probability that the current price action will not exceed that certain band. For the 1st level (1st std-dev) it is 68.3%, for the second level 95.4% and the third 99.7% that the price will close not exceeding that level, assuming normal distribution of underlying log returns.
Meaning of the future prediction of RMLR
If the Direction of past Price Action is UP then the Direction of the related RMLR IN THE FUTURE will most probably be UP.
If the Direction of past Price Action is DOWN then the Direction of the related RMLR IN THE FUTURE will most probably be DOWN.
In other words, Past Price Action of any specific candle determines the Direction of the Future RMLR produced from that past PA candle.
In other words, when RMLR is working on normal settings, Past Price Action does in fact predict future RML Returns.
RMLR Input Settings
SAMPLE SIZE - the lookback period.
SHOW STANDARD DEVIATION BANDS - the ability to choose 1st, 2nd or 3rd standard deviation ranges.
SWITCH BAR COLOR BY TREND - when selected the bar color will show bullish trend above the mean and bearish trend below the mean.
SHOW RMLR PREDICTION - when selected you can view the predicted future RMLR based on past price action.
LOCK ON - options to choose what future prediction you want to view. mean, 1st, 2nd and 3rd standard deviations are your choices.
OVERRIDE CONTINUOUS MARKET PROTECTION - when selected you can view the future RMLR prediction on non-continuous markets. USE AT YOUR OWN RISK.
CORRELATION COEFFICIENT SETTINGS - option to set the lookback length for the correlation between the RMLR and price action.
RMLR DISPLAY SETTINGS - allows you to choose from 5 different color schemes for the inner, 1st and 2nd outside lines for the RMLR. You can also adjust the border line widths and the colors for correlation coefficient direction and significant correlation.
DIRECTION PREDICTOR COLORS - allows you to set up predictor lengths, sensitivity settings and color options.
DIRECTION TREND COLORS - allows you to set up trend lengths, sensitivity settings and color options.
References
quantivity.wordpress.com/2011/02/21/why-log-returns/
Here at Alpha Trading, we create indicators that are based on Volatility, Probability and Statistics. We always add our own secret sauce, to turn mathematical principles into indicators that are tradeable. If you have been here for a while, or even if you are new, you have most likely heard us talk about Returns in our other indicators such as the Wolfsbane, RMS Z-Score or some of our returns based oscillators.
Theory
Log Returns of Price are commonly used to normalize price action. In contrast to price which never reverts to the mean, log returns are mean reverting.
In addition we assume that log returns are normally distributed, whereas price is never normally distributed. Price is log normal distributed, therefore it is wrong to calculate standard deviation directly on price, like in Bollinger bands. But for the normal distributed log returns it is mathematically correct and can be used to find extremes of the market.
Why did we create the RMLR
What if we could see that mean (where the log returns will reverse) and market extremes (multiples of standard deviations) on a price scale? Well, that's our Reverse Mean Log Returns (RMLR) indicator.
RMLR shows the Reverse Mean of Log Returns and their first, second and third standard deviation. These levels represent the probability that the current price action will not exceed that certain band. For the 1st level (1st std-dev) it is 68.3%, for the second level 95.4% and the third 99.7% that the price will close not exceeding that level, assuming normal distribution of underlying log returns.
Meaning of the future prediction of RMLR
If the Direction of past Price Action is UP then the Direction of the related RMLR IN THE FUTURE will most probably be UP.
If the Direction of past Price Action is DOWN then the Direction of the related RMLR IN THE FUTURE will most probably be DOWN.
In other words, Past Price Action of any specific candle determines the Direction of the Future RMLR produced from that past PA candle.
In other words, when RMLR is working on normal settings, Past Price Action does in fact predict future RML Returns.
RMLR Input Settings
SAMPLE SIZE - the lookback period.
SHOW STANDARD DEVIATION BANDS - the ability to choose 1st, 2nd or 3rd standard deviation ranges.
SWITCH BAR COLOR BY TREND - when selected the bar color will show bullish trend above the mean and bearish trend below the mean.
SHOW RMLR PREDICTION - when selected you can view the predicted future RMLR based on past price action.
LOCK ON - options to choose what future prediction you want to view. mean, 1st, 2nd and 3rd standard deviations are your choices.
OVERRIDE CONTINUOUS MARKET PROTECTION - when selected you can view the future RMLR prediction on non-continuous markets. USE AT YOUR OWN RISK.
CORRELATION COEFFICIENT SETTINGS - option to set the lookback length for the correlation between the RMLR and price action.
RMLR DISPLAY SETTINGS - allows you to choose from 5 different color schemes for the inner, 1st and 2nd outside lines for the RMLR. You can also adjust the border line widths and the colors for correlation coefficient direction and significant correlation.
DIRECTION PREDICTOR COLORS - allows you to set up predictor lengths, sensitivity settings and color options.
DIRECTION TREND COLORS - allows you to set up trend lengths, sensitivity settings and color options.
References
quantivity.wordpress.com/2011/02/21/why-log-returns/
版本注释
- Prediction model: enhanced for continuous markets.
- Prediction model: shows multiple bands and RMLR predictions at once.
- Enhanced coloring options.
- Band plot with custom sample size.
- Prediction customizations.
仅限邀请脚本
只有作者授权的用户才能访问此脚本。您需要申请并获得使用许可。通常情况下,付款后即可获得许可。更多详情,请按照下方作者的说明操作,或直接联系AlphaTrading-WolfPack。
TradingView不建议您付费购买或使用任何脚本,除非您完全信任其作者并了解其工作原理。您也可以在我们的社区脚本找到免费的开源替代方案。
作者的说明
https://discord.gg/TdczYdQzpT
To gain access to this script get support in the Alpha Trading Discord.
免责声明
这些信息和出版物并非旨在提供,也不构成TradingView提供或认可的任何形式的财务、投资、交易或其他类型的建议或推荐。请阅读使用条款了解更多信息。