OPEN-SOURCE SCRIPT
Blai5 Astro Indicator
The original script was posted on ProRealCode by user Nicolas.
Trend indicator based on the calculation of time on operational stockings Blai5 Vigia. Need volumes to compute correctly.
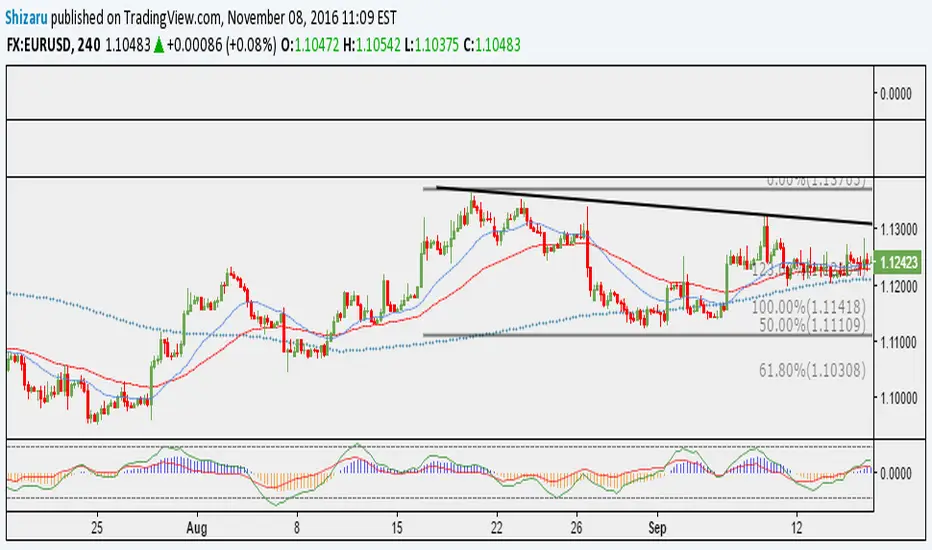
The indicator consists of three lines. The first (MR and MF) two form a ribbon that crosses regularly. Astro is the value of the difference between the two lines, and should be interpreted as we would MACD histogram.
The indicator can be configured and operated in various ways. It can be used simply making visible the Astro curve, or also presenting the "treadmill" that make up MR and MF; alone or with Astro.
Operating this trend indicator is not difficult, it gives many possibilities presenting a wealth of signs, more than the usual in this type of indicators. In principle, when MR (red) is higher than MF (blue), the time is positive and the value is likely to increase or, failing that, resist the descent; and vice versa.
It can be operated by crosses both lines (= crossings Astro on the zero line), but the most aggressive user will quickly realize that also offers the possibility to operate between extremes, slope and even by divergence, where the Astro tape is very rich.
The timing of the cycle (T) can be adjusted to better match assets and temporality wishing surgery.
Trend indicator based on the calculation of time on operational stockings Blai5 Vigia. Need volumes to compute correctly.
The indicator consists of three lines. The first (MR and MF) two form a ribbon that crosses regularly. Astro is the value of the difference between the two lines, and should be interpreted as we would MACD histogram.
The indicator can be configured and operated in various ways. It can be used simply making visible the Astro curve, or also presenting the "treadmill" that make up MR and MF; alone or with Astro.
Operating this trend indicator is not difficult, it gives many possibilities presenting a wealth of signs, more than the usual in this type of indicators. In principle, when MR (red) is higher than MF (blue), the time is positive and the value is likely to increase or, failing that, resist the descent; and vice versa.
It can be operated by crosses both lines (= crossings Astro on the zero line), but the most aggressive user will quickly realize that also offers the possibility to operate between extremes, slope and even by divergence, where the Astro tape is very rich.
The timing of the cycle (T) can be adjusted to better match assets and temporality wishing surgery.
开源脚本
秉承TradingView的精神,该脚本的作者将其开源,以便交易者可以查看和验证其功能。向作者致敬!您可以免费使用该脚本,但请记住,重新发布代码须遵守我们的网站规则。
免责声明
这些信息和出版物并非旨在提供,也不构成TradingView提供或认可的任何形式的财务、投资、交易或其他类型的建议或推荐。请阅读使用条款了解更多信息。
免责声明
这些信息和出版物并非旨在提供,也不构成TradingView提供或认可的任何形式的财务、投资、交易或其他类型的建议或推荐。请阅读使用条款了解更多信息。