OPEN-SOURCE SCRIPT
GMMA Toolkit [QuantVue]
The GMMA Toolkit is designed to leverage the principles of the Guppy Multiple Moving Average (GMMA). This indicator is equipped with multiple features to help traders identify trends, reversals, and periods of market compression.
The Guppy Multiple Moving Average (GMMA) is a technical analysis tool developed by Australian trader and author Daryl Guppy in the late 1990s.
It utilizes two sets of Exponential Moving Averages (EMAs) to capture both short-term and long-term market trends. The short-term EMAs represent the activity of traders, while the long-term EMAs reflect the behavior of investors.
By analyzing the interaction between these two groups of EMAs, traders can identify the strength and direction of trends, as well as potential reversals.

Due to the nature of GMMA, charts can become cluttered with numerous lines, making analysis challenging.
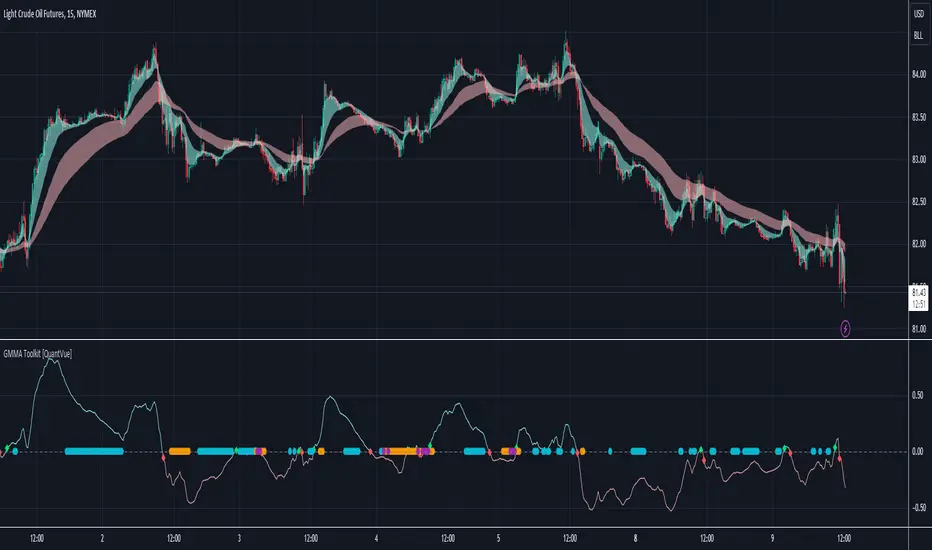
However, this indicator simplifies visualization by using clouds to represent the short-term and long-term EMA groups, determined by filling the area between the maximum and minimum EMAs in each group.

The GMMA Toolkit goes a step further and includes an oscillator that measures the difference between the average short-term and long-term EMAs, providing a clear visual representation of trend strength and direction.
The farther the oscillator is from the 0 level, the stronger the trend. It is plotted on a separate panel with values above zero indicating bullish conditions and values below zero indicating bearish conditions.

The inclusion of the oscillator in the GMMA Toolkit allows traders to identify earlier buy and sell signals based on the GMMA oscillator crossing the zero line compared to traditional crossover methods.

Lastly, the GMMA Toolkit features compression dots that indicate periods of market consolidation.
By measuring the spread between the maximum and minimum EMAs within both short-term and long-term groups, the indicator identifies when these spreads are significantly narrower than average by comparing the current spread to the average spread over a lookback period.
This visual cue helps traders anticipate potential breakout or breakdown scenarios, enhancing their ability to react to imminent trend changes.

By simplifying the visualization of the Guppy Multiple Moving Averages with clouds, providing earlier buy and sell signals through the oscillator, and highlighting periods of market consolidation with compression dots, this toolkit offers traders insightful tools for navigating market trends and potential reversals.
Give this indicator a BOOST and COMMENT your thoughts below!
We hope you enjoy.
Cheers!
The Guppy Multiple Moving Average (GMMA) is a technical analysis tool developed by Australian trader and author Daryl Guppy in the late 1990s.
It utilizes two sets of Exponential Moving Averages (EMAs) to capture both short-term and long-term market trends. The short-term EMAs represent the activity of traders, while the long-term EMAs reflect the behavior of investors.
By analyzing the interaction between these two groups of EMAs, traders can identify the strength and direction of trends, as well as potential reversals.
Due to the nature of GMMA, charts can become cluttered with numerous lines, making analysis challenging.
However, this indicator simplifies visualization by using clouds to represent the short-term and long-term EMA groups, determined by filling the area between the maximum and minimum EMAs in each group.
The GMMA Toolkit goes a step further and includes an oscillator that measures the difference between the average short-term and long-term EMAs, providing a clear visual representation of trend strength and direction.
The farther the oscillator is from the 0 level, the stronger the trend. It is plotted on a separate panel with values above zero indicating bullish conditions and values below zero indicating bearish conditions.
The inclusion of the oscillator in the GMMA Toolkit allows traders to identify earlier buy and sell signals based on the GMMA oscillator crossing the zero line compared to traditional crossover methods.
Lastly, the GMMA Toolkit features compression dots that indicate periods of market consolidation.
By measuring the spread between the maximum and minimum EMAs within both short-term and long-term groups, the indicator identifies when these spreads are significantly narrower than average by comparing the current spread to the average spread over a lookback period.
This visual cue helps traders anticipate potential breakout or breakdown scenarios, enhancing their ability to react to imminent trend changes.
By simplifying the visualization of the Guppy Multiple Moving Averages with clouds, providing earlier buy and sell signals through the oscillator, and highlighting periods of market consolidation with compression dots, this toolkit offers traders insightful tools for navigating market trends and potential reversals.
Give this indicator a BOOST and COMMENT your thoughts below!
We hope you enjoy.
Cheers!
开源脚本
秉承TradingView的精神,该脚本的作者将其开源,以便交易者可以查看和验证其功能。向作者致敬!您可以免费使用该脚本,但请记住,重新发布代码须遵守我们的网站规则。
Get Access to the exclusive QuantVue indicators: quantvue.io/
Join thousands of traders in our Free Discord: discord.gg/tC7u7magU3
Join thousands of traders in our Free Discord: discord.gg/tC7u7magU3
免责声明
这些信息和出版物并非旨在提供,也不构成TradingView提供或认可的任何形式的财务、投资、交易或其他类型的建议或推荐。请阅读使用条款了解更多信息。