OPEN-SOURCE SCRIPT
已更新 Expected Volatility
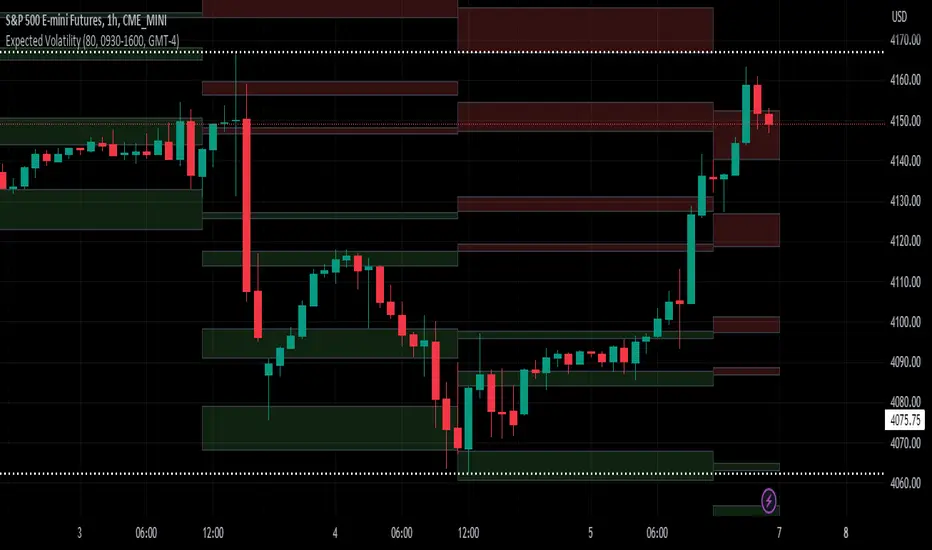
Expected Volatility
Hello and welcome to my first indicator! I'm publishing this indicator as free to use and modify because I think it's a great place to learn and I hope I can teach you something.
There are some terms which you need to understand before I begin explaining this indicator and what it does for you:
Daily Settlement - The price at which a market closes when the trading day closes (RTH or Regular Trading Hours close)
Standard Deviation - A measure in statistics that declares how far away a data point is from the mean when compared with all the data points before it to an extent
Now for the history behind this indicator:
Rule of 16. This goes back to the VIX, or S&P 500 volatility index. The idea behind the volatility index is to determine what magnitude of movement could be expected from the market the following day based on recent movement. The rule of 16 is an easier way to refer to the square root of the number of trading days in a year. There are 252 trading days in a year and the square root of 252 is approximately 15.87. We estimate it to be 16 because it's easier to talk about when it's easier to say and therefore easier to remember.
The relevance of this rule is that when the VIX is at 16, we can expect a market movement of 1% or so unless some special circumstances overrule this estimate. To get the expected market movement, we take 16 and divide by 16 and get 1, or 1%. If the VIX is trading at 24, we get 24/16 or 1.5 which is 1.5% movement. This indicator seeks to simplify the math and lay it out in a visual way to show the highest probability of range the market is expected to trade.
Thanks for taking the time to read my description, I hope you like my indicator.
Special thanks to my trading friends and coaches for helping me complete this indicator.
版本注释
Added support for YM / VXD to allow usage with the Dow Jones futures contract set.Supported markets are now:
ES/VIX
NQ/VOLQ
CL/OVX
RTY/RVX
VIX/VVIX
GC/GVZ
SI/VXSLV
YM/VXD
Future release may include use of a for loop to iterate through pairs of markets to make adding new markets easier.
版本注释
Updated the volatility source for NQ to be VXN over VOLQ as NASDAQ:VOLQ is discontinued.开源脚本
秉承TradingView的精神,该脚本的作者将其开源,以便交易者可以查看和验证其功能。向作者致敬!您可以免费使用该脚本,但请记住,重新发布代码须遵守我们的网站规则。
免责声明
这些信息和出版物并非旨在提供,也不构成TradingView提供或认可的任何形式的财务、投资、交易或其他类型的建议或推荐。请阅读使用条款了解更多信息。
开源脚本
秉承TradingView的精神,该脚本的作者将其开源,以便交易者可以查看和验证其功能。向作者致敬!您可以免费使用该脚本,但请记住,重新发布代码须遵守我们的网站规则。
免责声明
这些信息和出版物并非旨在提供,也不构成TradingView提供或认可的任何形式的财务、投资、交易或其他类型的建议或推荐。请阅读使用条款了解更多信息。