OPEN-SOURCE SCRIPT
Multi Asset + Correlation Overlay
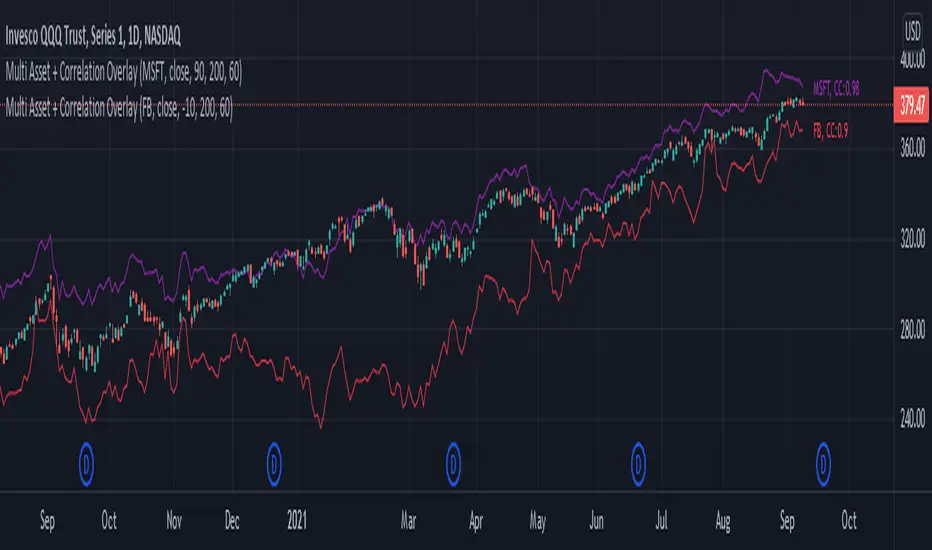
From time to time, you may want to overlay multiple assets on the same chart instead of using multi-chart views. This can be a much cleaner way of viewing and comparing multiple assets. There is some functionality built into TradingView that lets you do this to a certain extent, but I wanted additional options, correlation labeling and ways to adjust the overlay location. So, today I am releasing to the community my Multi-Asset + Correlation Overlay script / indicator.
What is does: This script allows you to overlay the price of any ticker onto your chart. It also labels the line with the ticker name, and calculates / labels the correlation coefficient of your newly overlayed asset.
How to use it: Add the indicator to your chart. Then, go into the indicator settings to set the ticker of the asset you want to pull in along with how you want to "offset" it. Your 2 tickers may not be priced near each-other, so the offset setting allows you to pull the ticker you added up/down to better visually align with your chart's price range/layout. For instance, if the asset you added is priced $400 higher than the underlying chart price, you may want to set the offset to -400.
If you would like to add multiple tickers and multiple overlays, you can do that by just adding the indicator to your chart more than once. The color is adjustable, and the ticker of the asset will print to the right of the line representing the asset price. The script also calculates the correlation coefficient between the ticker overlay and the underlying chart asset. The correlation coefficient prints to the right of the ticker.
开源脚本
秉承TradingView的精神,该脚本的作者将其开源,以便交易者可以查看和验证其功能。向作者致敬!您可以免费使用该脚本,但请记住,重新发布代码须遵守我们的网站规则。
Want to build custom alerts and custom strategies? Interested in automated trading?
Hire me to code or automate your trading strategy, or schedule a free consultation at:
TradeAutomation.net
Hire me to code or automate your trading strategy, or schedule a free consultation at:
TradeAutomation.net
免责声明
这些信息和出版物并非旨在提供,也不构成TradingView提供或认可的任何形式的财务、投资、交易或其他类型的建议或推荐。请阅读使用条款了解更多信息。