INVITE-ONLY SCRIPT
已更新 Order Flow Footprint Real-time
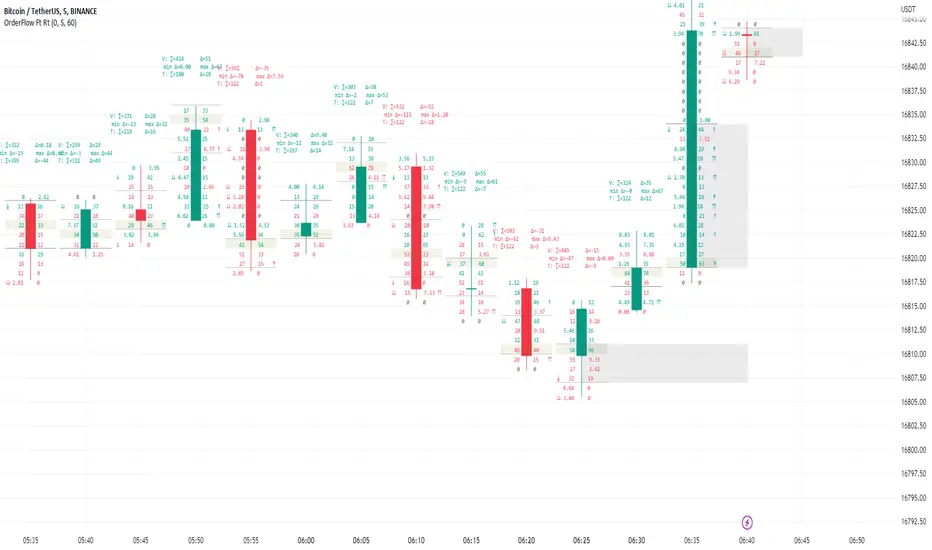
Order Flow Footprint Real-time chart (also known as Cluster chart, bid/ask profile, bid/ask cluster, numbered bars) is a concept of drawing candle internal structure and showing bid and ask transactions inside the candle.
Values on left side of a candle are bids - Transactions done by active sellers with passive buyers.
Values on right side of a candle are asks - Transactions done by active buyers with passive sellers.
This script is a part of a toolkit called "Order Flow":
Order Flow Register - Register showing list of recently done transactions with clasification on bids and asks.
Order Flow Footprint Realtime - Tool showing bid and ask structure of transactions inside realtime candles.
Order Flow Footprint Estimation - Tool showing estimated bid and ask structure based on historical data.
This tool requires frequently updated real-time data to work efficiently. It cannot analyze historic charts. If you need footprint of historic data just use Order Flow Footprint Estimation instead.
Warning !
TradingView has a data delay feature on many exchanges (10-30 minutes) and real-time data are extra paid in that case. Missing real-time data source will limit the functionality of the script to educational purposes only.
User Interface:
Script is drawing volume values grouped into price slots. Price slots height is controled by slot height param in settings.
Volume values are clasified as bids and asks and draw on opposite sides of a candle. On left side of a candle bid volume values are shown and on right side ask volume values are shown.
Before bid values may appear symbols of sellers aggressiveness compared with buyers:
↓ - 3 times
↡ - 5 times
⇊ - 10 times
After ask values may appear symbol of buyers aggressiveness compared with sellers:
↑ - 3 time
↟ - 5 times
⇈ - 10 times
Above the candle we have some statistics of that candle:
"V:" - Row with volume statistics: ∑ - Total volume, Δ - Difference between asks and bids (typically negative in down trend and positive in up trend). Below the smallest and largest delta values recorded during this candle.
"T:" - Row with transaction estimations: ∑ - Estimation of total transactions, Δ - Difference between number of ask and bid transaction estimations
Script settings:
Slot height = 10^ - Price slot height on the chart:
0 - 1$
1 = 10$
2 = 100$
3 = 1000$
-1 = 0.1$
-2 = 0.01$
-3 = 0.001$
Font size - Font size used to draw all the data over the chart: Tiny, Small, Normal, Large
Centered - If checked volume labels are stick to candle
Draw bars - Option of drawing candles fiting to volume labels and 2 fields for picking colors of up and down candles.
Underline biggest slot - Option to underline price slot with biggest volume in the candle.
Color values - Option to draw labels with use of Ask and Bid colors, depending on which value is bigger in the price slot.
Troubleshooting:
In case of any problems, please send error details to the author of the script.
版本注释
"Show zeros" - Flag showing/hiding slots with "0" value版本注释
Script Settings update: Highlight biggest slot - Option to highlight price slot with biggest volume in the candle with picked color.
Show candle core – Option to mark group of slots with biggest volume having at least n (20-90)% of candle volume. Group will be marked with picked color.
Show warnings – Flag enabling/disabling warning messages (e.g. incorrect precision). If warnings are disabled only errors will appear in the dialog.
版本注释
Option to "Track" candle cores (value areas) and "Only active" filter for tracking 仅限邀请脚本
只有作者授权的用户才能访问此脚本。您需要申请并获得使用许可。通常情况下,付款后即可获得许可。更多详情,请按照下方作者的说明操作,或直接联系Investor_R。
TradingView不建议您付费购买或使用任何脚本,除非您完全信任其作者并了解其工作原理。您也可以在我们的社区脚本找到免费的开源替代方案。
作者的说明
Write to toolkit4trading@gmail.com to get access.
To get access or report problem write on toolkit4trading@proton.me
More details on Website and Youtube.
More details on Website and Youtube.
免责声明
这些信息和出版物并非旨在提供,也不构成TradingView提供或认可的任何形式的财务、投资、交易或其他类型的建议或推荐。请阅读使用条款了解更多信息。
仅限邀请脚本
只有作者授权的用户才能访问此脚本。您需要申请并获得使用许可。通常情况下,付款后即可获得许可。更多详情,请按照下方作者的说明操作,或直接联系Investor_R。
TradingView不建议您付费购买或使用任何脚本,除非您完全信任其作者并了解其工作原理。您也可以在我们的社区脚本找到免费的开源替代方案。
作者的说明
Write to toolkit4trading@gmail.com to get access.
To get access or report problem write on toolkit4trading@proton.me
More details on Website and Youtube.
More details on Website and Youtube.
免责声明
这些信息和出版物并非旨在提供,也不构成TradingView提供或认可的任何形式的财务、投资、交易或其他类型的建议或推荐。请阅读使用条款了解更多信息。