PROTECTED SOURCE SCRIPT
已更新 Index Lead Lag
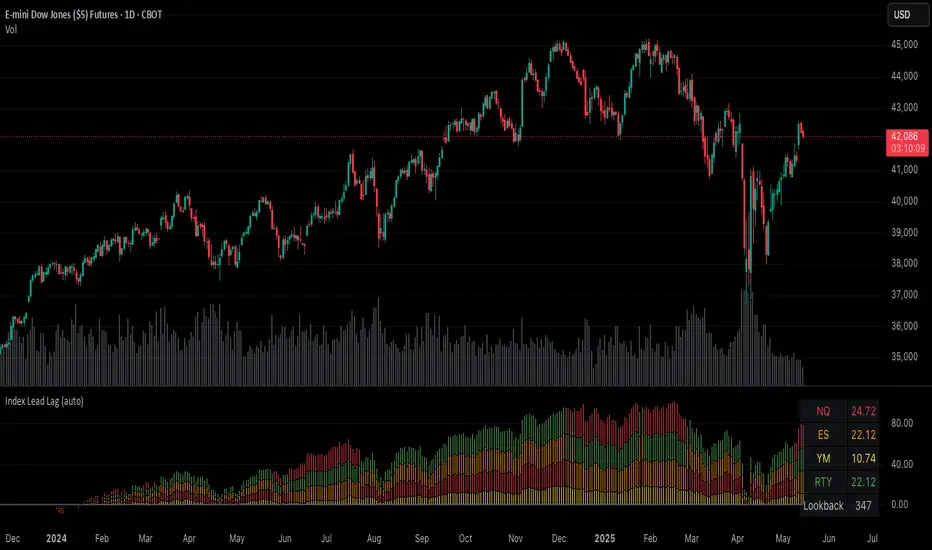
Plots the percent change of each index over a given input lookback window length.
Indices are color coded (and customizable) to identify their respective percent change in the stacked column plot.
Table at the bottom right shows the previously closed bar's percent changes.
Indicator indicates which indices are leading and lagging over the given lookback period.
Indices are color coded (and customizable) to identify their respective percent change in the stacked column plot.
Table at the bottom right shows the previously closed bar's percent changes.
Indicator indicates which indices are leading and lagging over the given lookback period.
版本注释
Add index changes to status line visualization版本注释
Updated default lookback length for improved visibility of trend版本注释
Added an optional highlight on the reference bar anchor for the current bar's percent change calculation. Highlighted bar appears `lookback window bars input` to the left of the current bar.版本注释
Adds a vertical bar selector for the comparison start point. Click on the indicator then move the vertical bar to the desired chart data.版本注释
Allow setting comparison anchor point between:* Time based using vertical selector bar (or timestamp input option)
* Fixed number of bars
版本注释
bug fix with disabling the table view版本注释
try that again版本注释
v1.1Added a zero reference line on the plot to distinguish positive and negative changes.
受保护脚本
此脚本以闭源形式发布。 但是,您可以自由使用,没有任何限制 — 了解更多信息这里。
免责声明
这些信息和出版物并非旨在提供,也不构成TradingView提供或认可的任何形式的财务、投资、交易或其他类型的建议或推荐。请阅读使用条款了解更多信息。
受保护脚本
此脚本以闭源形式发布。 但是,您可以自由使用,没有任何限制 — 了解更多信息这里。
免责声明
这些信息和出版物并非旨在提供,也不构成TradingView提供或认可的任何形式的财务、投资、交易或其他类型的建议或推荐。请阅读使用条款了解更多信息。