搜索
产品
社区
市场
经纪商
更多
CN
开始
OPEN-SOURCE SCRIPT
2014年7月20日
TTM Squeeze
图表
原始码
更多
添加到收藏
添加到收藏
在图表上使用
9.7 K
38
38
186 854
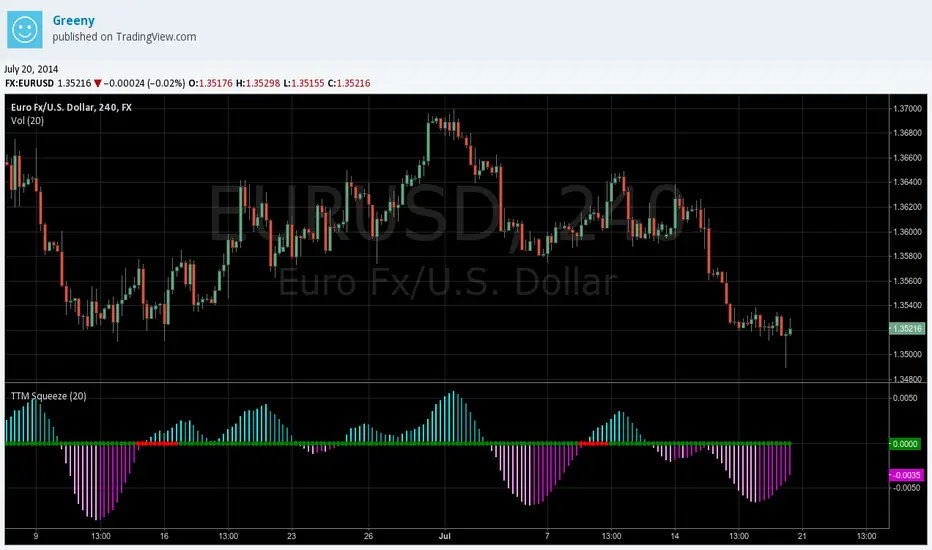
John Carter's TTM Squeeze indicator
开源脚本
秉承TradingView的精神,该脚本的作者将其开源,以便交易者可以查看和验证其功能。向作者致敬!您可以免费使用该脚本,但请记住,重新发布代码须遵守我们的
网站规则
。
Greeny
关注
Oscillators
免责声明
这些信息和出版物并非旨在提供,也不构成TradingView提供或认可的任何形式的财务、投资、交易或其他类型的建议或推荐。请阅读
使用条款
了解更多信息。
Oscillators
开源脚本
秉承TradingView的精神,该脚本的作者将其开源,以便交易者可以查看和验证其功能。向作者致敬!您可以免费使用该脚本,但请记住,重新发布代码须遵守我们的
网站规则
。
Greeny
关注
免责声明
这些信息和出版物并非旨在提供,也不构成TradingView提供或认可的任何形式的财务、投资、交易或其他类型的建议或推荐。请阅读
使用条款
了解更多信息。