INVITE-ONLY SCRIPT
已更新 RSI Pro Suite (Zeiierman)
█ Overview
RSI Pro Suite (Zeiierman) is a complete RSI ecosystem built on an Efficient Price foundation. Instead of feeding RSI with the standard close, the script first converts price into an adaptive, efficiency-weighted trajectory known as Efficient Price. All major components of the tool, including the Efficient Price RSI, Significant RSI Moves, the divergence engine, the inefficiency layer, the momentum impulse system, and the multi-timeframe dashboard, are built on top of this refined data stream.
The result is an RSI that looks and behaves like a familiar oscillator while reflecting deeper qualities of the market, such as regime stability, volatility behavior, and directional consistency. It supports both discretionary and systematic workflows, whether you rely on classic overbought and oversold readings or more advanced interpretations such as significant internal RSI pressure, inefficiency clusters, divergence structures, and momentum bursts.

⚪ Why This One Is Unique
RSI Pro Suite does not treat RSI as a simple calculation on price. It embeds RSI inside a two-stage Efficient Price framework that reshapes how trend, rotation, and reversal pressure are interpreted. The chosen EP source (Close, Mean-reversion, or Trend) is first processed through an adaptive efficiency model that filters noise and enhances structural meaning. A second refinement pass produces the foundation for the EP-RSI, giving it a cleaner and more context-aware behavior than standard RSI.
Around this core, the script layers several specialized systems. Significant RSI Moves identify internal pressure zones where momentum stretches, revealing shifts that often occur before they appear on price.
█ Main Features
⚪ EP- Based RSI
The core of RSI Pro Suite is an RSI built on a refined Efficient Price rather than raw price, providing a cleaner and more structurally meaningful oscillator. It maintains the classic RSI visual style with 70/30 bands, a 50 midline, and soft gradient fills that express overbought and oversold tension. A smoothing layer allows several moving-average options for the RSI. This creates an intuitive environment for reading trend strength, exhaustion, and mean-reversion with far greater clarity than a standard RSI.
The Efficient Price engine can be driven by three behavioral modes that reshape the character of the RSI, allowing the indicator to adapt to different market conditions and trading styles.
Close
This mode follows price action directly, mirroring the natural rhythm of the market. It is the most general-purpose option and provides a balanced read of both trend and rotation, making it suitable for the majority of market environments.

Mean-reversion
Mean-reversion mode focuses on swing turns and snap-back behavior, emphasizing RSI-based cyclical reversals. It highlights oscillatory structures, swing reactions, and fading opportunities, making it highly effective for traders who target reversal setups or rotational markets.

Trend
The Trend mode uses a trend-smoothed input that emphasizes directional drift and sustained momentum. It provides clearer insight into trend continuation, trend maturity, and structural strength, helping traders stay aligned with broader directional moves.

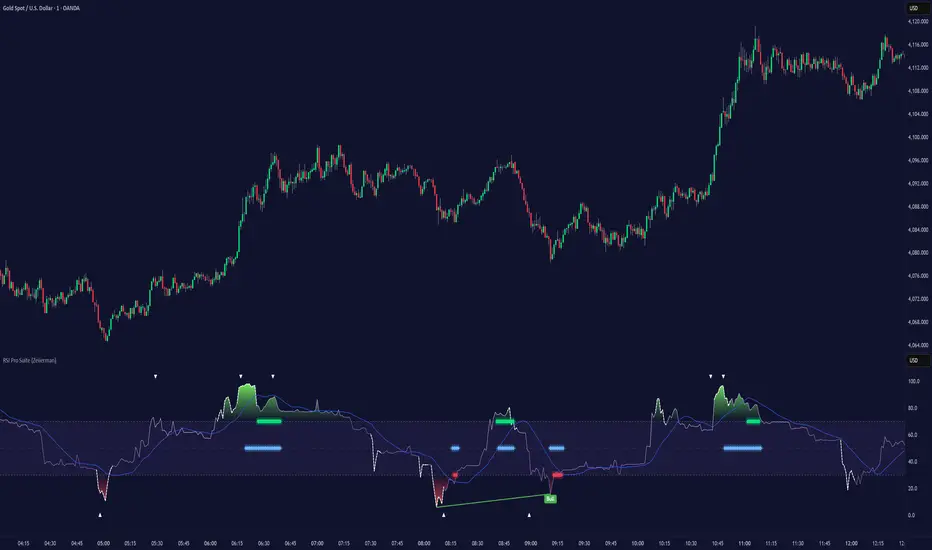
⚪ Significant RSI Moves
RSI Pro Suite detects when RSI trades within its most important internal zones—areas where price has historically shown elevated reaction potential. The system continuously evaluates the structure of the RSI range and identifies moments when internal pressure becomes meaningful. When these conditions align, the indicator highlights Significant RSI Movements, revealing subtle but powerful structural shifts before they appear on price itself.

⚪ Divergence Detection
The suite includes regular bullish and bearish divergence detection between EP-RSI and price. It identifies clear pivot structures, marks them directly on the RSI pane, and labels each as Bull or Bear. Because divergences are evaluated using the Efficient Price RSI, the signals appear cleaner and less noisy, making them more reliable during both trend reversals and continuation setups.

⚪ Impulse
Momentum impulses appear when the RSI and Price exhibits unusually strong acceleration. Green circles near the upper region indicate sharp upside bursts, while red circles near the lower region reveal powerful downside surges. These impulses highlight moments of expansion, exhaustion, or sudden strength that stand out from typical RSI behavior.

⚪ Inefficiency Diamonds
Whenever the internal logic detects an inefficiency regime, the indicator plots blue diamonds on the mid-level. These diamonds mark structurally imbalanced or spiky conditions that often precede reaction swings, failed pushes, or key turning points in momentum.

⚪ Visual Multi-Timeframe Dashboard
A right-side dashboard provides a compact real-time overview of multiple structural signals across 5M, 15M, 1H, 2H, 4H, and 1D timeframes:

█ How to Use
⚪ Classic RSI Trading
Interpreting it is similar to a classic RSI but with structurally cleaner input. Sustained movement above the 50 midline reflects a bullish regime in the Efficient Price environment; persistent movement below 50 reflects a bearish regime. When EP-RSI repeatedly leans against the upper band near 70 while its smoothing line rises, it indicates strong upside control; repeated engagement with the lower band near 30 with a falling smoother indicates strong downside control.

⚪ Trend Trading
Use the Trend EP mode to smooth the RSI and track directional movement more clearly. When the RSI holds above the midline during an uptrend or below it during a downtrend, stay aligned with the direction. The multi-timeframe dashboard helps confirm trend strength by showing whether higher-timeframe signals agree with your chart.
Look for impulse markers and clean directional signals as continuation cues, and use inefficiency or weakening impulses as early signs to scale out or tighten stops.

⚪ Pullback Trading
Enable Trend mode and increase the length to 20 or higher. Then enable the Standard RSI and set it to 7. This configuration helps you track broader trends with the EP-RSI while using the shorter-period standard RSI to identify pullback opportunities within that trend.
When the EP-RSI is clearly green or red, indicating an established trend, begin watching the standard RSI for oversold or overbought conditions. These signals often mark clean pullbacks within the larger move. Entering during these moments allows you to participate in the continuation of the trend with improved timing and reduced risk.

⚪ Overbought/Oversold Trading
Treat the 70/30 regions as pressure zones, not automatic reversal signals. Use OB/OS flags on the dashboard to check whether multiple timeframes are stretched in the same direction. When price enters an overextended area, watch for Significant RSI Moves or impulse exhaustion markers to time entries or exits more precisely. This approach helps you avoid fading strong trends and instead focus on moments where reactions or pauses are more likely.

⚪ Mean-reversion Trading
Switch to Mean-reversion mode when focusing on turning points. This mode emphasizes snap-back behavior and makes reversal zones clearer. Combine reversal attempts with divergence signals, Significant RSI Moves, and impulse exhaustion markers. When several of these appear at once, especially across multiple timeframes on the dashboard, you have a stronger reversal setup.

⚪ Divergence Trading
Enable divergence detection when you want to focus on turning points rather than trend following. Bullish divergence occurs when price prints a lower low but the EP-RSI prints a higher low at a labeled pivot; bearish divergence occurs when price prints a higher high but the EP-RSI prints a lower high.
These divergences are most effective when they form near the 30 and 70 regions or after extended runs. A bullish divergence emerging from an oversold region can be used as confirmation to scale into long ideas; a bearish divergence near overbought regions can support profit-taking or contrarian short setups.

⚪ Breakout Trading
In breakout conditions, Significant RSI Moves and impulse markers work together as confirmation tools. When price pushes through a resistance level and the RSI prints a Significant RSI Move at the same time, it shows that internal momentum has shifted decisively in favor of the breakout. If this move is supported by green upper impulse markers, it strengthens the case that buyers are driving the move with conviction rather than the breakout occurring on weak momentum.
During a retest of the breakout zone, these signals become even more valuable. A Significant RSI Move forming at the retest, especially when paired with a fresh impulse burst, often marks strong rejection from the level and signals that the breakout structure is holding. This combination highlights areas where buyers are stepping in aggressively to defend the level.
The same concepts apply in reverse during breakdowns. A Significant RSI Move occurring at support alongside red downside impulses confirms heavy selling pressure and adds confidence to continuation entries. If such signals appear after an extended move, they can also highlight capitulation points that precede sharp reversals.
This makes Significant RSI Moves and impulse markers highly effective for validating breakouts, evaluating retests, and timing continuation or rejection trades with much greater precision.

⚪ Reversal Trading
Use contrarian signals to identify areas that may offer attractive reversal opportunities. These signals highlight moments when the market is stretched and showing signs of exhaustion, which can develop into a broader shift in direction. Combine them with Significant RSI Moves and impulse markers to gauge the strength and credibility of the potential reversal, especially around key levels or after extended trends.

⚪ Interpreting Inefficiency Regime
Watch the diamonds associated with the inefficiency regime as contextual signals. When they cluster following a smooth, steady trend, they often mark zones where the process shifts from “clean trend” to “noisy” or “imbalanced” behavior. Combined with EP-RSI rolling over from an extreme or divergence labels appearing nearby, such clusters can highlight high-value inflection areas.

⚪ Overview Panel
Use the right-hand dashboard as a quick alignment guide rather than a direct signal generator. Each row represents a different structural component of the market, and each column represents a timeframe from 5M to 1D. The Signals row shows immediate directional bias, OB/OS highlights stretched conditions, Divergence marks structural disagreement, Impulse reveals bursts of momentum, Inefficiency identifies unstable movement and Explosive highlights higher-timeframe volatility conditions.
The panel is most useful as a mental checklist. When several timeframes show similar characteristics, such as multiple signals pointing in the same direction or impulses aligning across the lower timeframes, the context for the trade becomes stronger. Mixed readings indicate hesitation or imbalance in the market, helping you avoid forcing trades during unclear conditions.
With coverage across 5M, 15M, 1H, 2H, 4H and 1D, the dashboard gives you an instant sense of whether momentum, pressure and structure are working together or pushing against each other, allowing you to judge at a glance whether the environment favors continuation, rotation or caution.
█ How It Works
⚪ EP Source and Pre-EP Layer
The system begins by selecting a core behavioral driver such as Close, Mean-Reversion, or Trend. This source is transformed into a stability-aware stream that evaluates how consistently the price is moving relative to its own volatility environment. Each movement is weighted by its structural quality rather than raw magnitude, producing a preliminary Efficient Price that reflects directional reliability instead of noise.
⚪ Main EP Engine and Adaptive Refinement
This first-stage Efficient Price is processed again through a second refinement pass, smoothing irregularities and further aligning the trajectory with coherent directional flow. The result is a fully refined Efficient Price that responds to meaningful structural shifts while avoiding the instability of raw price oscillation.
⚪ Inefficiency–Trend Blending
This component evaluates the EP-RSI through two behavioral lenses: inefficiency and trend. Inefficiency highlights spike-driven, imbalanced movement, while the trend component captures underlying directional slope and stability. A smooth blending mechanism transitions between these modes depending on where the system sits within efficiency space.
⚪ Momentum Impulse Modeling
Momentum impulses isolate moments when acceleration becomes unusually strong. The system exaggerates extreme RSI deviations while muting ordinary fluctuations, allowing only the sharpest bursts to stand out. A small clustering check eliminates transient noise, marking impulses only when structurally meaningful.
-----------------
Disclaimer
The content provided in my scripts, indicators, ideas, algorithms, and systems is for educational and informational purposes only. It does not constitute financial advice, investment recommendations, or a solicitation to buy or sell any financial instruments. I will not accept liability for any loss or damage, including without limitation any loss of profit, which may arise directly or indirectly from the use of or reliance on such information.
All investments involve risk, and the past performance of a security, industry, sector, market, financial product, trading strategy, backtest, or individual's trading does not guarantee future results or returns. Investors are fully responsible for any investment decisions they make. Such decisions should be based solely on an evaluation of their financial circumstances, investment objectives, risk tolerance, and liquidity needs.
RSI Pro Suite (Zeiierman) is a complete RSI ecosystem built on an Efficient Price foundation. Instead of feeding RSI with the standard close, the script first converts price into an adaptive, efficiency-weighted trajectory known as Efficient Price. All major components of the tool, including the Efficient Price RSI, Significant RSI Moves, the divergence engine, the inefficiency layer, the momentum impulse system, and the multi-timeframe dashboard, are built on top of this refined data stream.
The result is an RSI that looks and behaves like a familiar oscillator while reflecting deeper qualities of the market, such as regime stability, volatility behavior, and directional consistency. It supports both discretionary and systematic workflows, whether you rely on classic overbought and oversold readings or more advanced interpretations such as significant internal RSI pressure, inefficiency clusters, divergence structures, and momentum bursts.
⚪ Why This One Is Unique
RSI Pro Suite does not treat RSI as a simple calculation on price. It embeds RSI inside a two-stage Efficient Price framework that reshapes how trend, rotation, and reversal pressure are interpreted. The chosen EP source (Close, Mean-reversion, or Trend) is first processed through an adaptive efficiency model that filters noise and enhances structural meaning. A second refinement pass produces the foundation for the EP-RSI, giving it a cleaner and more context-aware behavior than standard RSI.
Around this core, the script layers several specialized systems. Significant RSI Moves identify internal pressure zones where momentum stretches, revealing shifts that often occur before they appear on price.
█ Main Features
⚪ EP- Based RSI
The core of RSI Pro Suite is an RSI built on a refined Efficient Price rather than raw price, providing a cleaner and more structurally meaningful oscillator. It maintains the classic RSI visual style with 70/30 bands, a 50 midline, and soft gradient fills that express overbought and oversold tension. A smoothing layer allows several moving-average options for the RSI. This creates an intuitive environment for reading trend strength, exhaustion, and mean-reversion with far greater clarity than a standard RSI.
The Efficient Price engine can be driven by three behavioral modes that reshape the character of the RSI, allowing the indicator to adapt to different market conditions and trading styles.
Close
This mode follows price action directly, mirroring the natural rhythm of the market. It is the most general-purpose option and provides a balanced read of both trend and rotation, making it suitable for the majority of market environments.
Mean-reversion
Mean-reversion mode focuses on swing turns and snap-back behavior, emphasizing RSI-based cyclical reversals. It highlights oscillatory structures, swing reactions, and fading opportunities, making it highly effective for traders who target reversal setups or rotational markets.
Trend
The Trend mode uses a trend-smoothed input that emphasizes directional drift and sustained momentum. It provides clearer insight into trend continuation, trend maturity, and structural strength, helping traders stay aligned with broader directional moves.
⚪ Significant RSI Moves
RSI Pro Suite detects when RSI trades within its most important internal zones—areas where price has historically shown elevated reaction potential. The system continuously evaluates the structure of the RSI range and identifies moments when internal pressure becomes meaningful. When these conditions align, the indicator highlights Significant RSI Movements, revealing subtle but powerful structural shifts before they appear on price itself.
⚪ Divergence Detection
The suite includes regular bullish and bearish divergence detection between EP-RSI and price. It identifies clear pivot structures, marks them directly on the RSI pane, and labels each as Bull or Bear. Because divergences are evaluated using the Efficient Price RSI, the signals appear cleaner and less noisy, making them more reliable during both trend reversals and continuation setups.
⚪ Impulse
Momentum impulses appear when the RSI and Price exhibits unusually strong acceleration. Green circles near the upper region indicate sharp upside bursts, while red circles near the lower region reveal powerful downside surges. These impulses highlight moments of expansion, exhaustion, or sudden strength that stand out from typical RSI behavior.
⚪ Inefficiency Diamonds
Whenever the internal logic detects an inefficiency regime, the indicator plots blue diamonds on the mid-level. These diamonds mark structurally imbalanced or spiky conditions that often precede reaction swings, failed pushes, or key turning points in momentum.
⚪ Visual Multi-Timeframe Dashboard
A right-side dashboard provides a compact real-time overview of multiple structural signals across 5M, 15M, 1H, 2H, 4H, and 1D timeframes:
- Directional Signals (up or down arrow)
- OB/OS flags
- Divergence state
- Impulse activity
- Inefficiency state
- Explosive conditions
█ How to Use
⚪ Classic RSI Trading
Interpreting it is similar to a classic RSI but with structurally cleaner input. Sustained movement above the 50 midline reflects a bullish regime in the Efficient Price environment; persistent movement below 50 reflects a bearish regime. When EP-RSI repeatedly leans against the upper band near 70 while its smoothing line rises, it indicates strong upside control; repeated engagement with the lower band near 30 with a falling smoother indicates strong downside control.
⚪ Trend Trading
Use the Trend EP mode to smooth the RSI and track directional movement more clearly. When the RSI holds above the midline during an uptrend or below it during a downtrend, stay aligned with the direction. The multi-timeframe dashboard helps confirm trend strength by showing whether higher-timeframe signals agree with your chart.
Look for impulse markers and clean directional signals as continuation cues, and use inefficiency or weakening impulses as early signs to scale out or tighten stops.
⚪ Pullback Trading
Enable Trend mode and increase the length to 20 or higher. Then enable the Standard RSI and set it to 7. This configuration helps you track broader trends with the EP-RSI while using the shorter-period standard RSI to identify pullback opportunities within that trend.
When the EP-RSI is clearly green or red, indicating an established trend, begin watching the standard RSI for oversold or overbought conditions. These signals often mark clean pullbacks within the larger move. Entering during these moments allows you to participate in the continuation of the trend with improved timing and reduced risk.
⚪ Overbought/Oversold Trading
Treat the 70/30 regions as pressure zones, not automatic reversal signals. Use OB/OS flags on the dashboard to check whether multiple timeframes are stretched in the same direction. When price enters an overextended area, watch for Significant RSI Moves or impulse exhaustion markers to time entries or exits more precisely. This approach helps you avoid fading strong trends and instead focus on moments where reactions or pauses are more likely.
⚪ Mean-reversion Trading
Switch to Mean-reversion mode when focusing on turning points. This mode emphasizes snap-back behavior and makes reversal zones clearer. Combine reversal attempts with divergence signals, Significant RSI Moves, and impulse exhaustion markers. When several of these appear at once, especially across multiple timeframes on the dashboard, you have a stronger reversal setup.
⚪ Divergence Trading
Enable divergence detection when you want to focus on turning points rather than trend following. Bullish divergence occurs when price prints a lower low but the EP-RSI prints a higher low at a labeled pivot; bearish divergence occurs when price prints a higher high but the EP-RSI prints a lower high.
These divergences are most effective when they form near the 30 and 70 regions or after extended runs. A bullish divergence emerging from an oversold region can be used as confirmation to scale into long ideas; a bearish divergence near overbought regions can support profit-taking or contrarian short setups.
⚪ Breakout Trading
In breakout conditions, Significant RSI Moves and impulse markers work together as confirmation tools. When price pushes through a resistance level and the RSI prints a Significant RSI Move at the same time, it shows that internal momentum has shifted decisively in favor of the breakout. If this move is supported by green upper impulse markers, it strengthens the case that buyers are driving the move with conviction rather than the breakout occurring on weak momentum.
During a retest of the breakout zone, these signals become even more valuable. A Significant RSI Move forming at the retest, especially when paired with a fresh impulse burst, often marks strong rejection from the level and signals that the breakout structure is holding. This combination highlights areas where buyers are stepping in aggressively to defend the level.
The same concepts apply in reverse during breakdowns. A Significant RSI Move occurring at support alongside red downside impulses confirms heavy selling pressure and adds confidence to continuation entries. If such signals appear after an extended move, they can also highlight capitulation points that precede sharp reversals.
This makes Significant RSI Moves and impulse markers highly effective for validating breakouts, evaluating retests, and timing continuation or rejection trades with much greater precision.
⚪ Reversal Trading
Use contrarian signals to identify areas that may offer attractive reversal opportunities. These signals highlight moments when the market is stretched and showing signs of exhaustion, which can develop into a broader shift in direction. Combine them with Significant RSI Moves and impulse markers to gauge the strength and credibility of the potential reversal, especially around key levels or after extended trends.
⚪ Interpreting Inefficiency Regime
Watch the diamonds associated with the inefficiency regime as contextual signals. When they cluster following a smooth, steady trend, they often mark zones where the process shifts from “clean trend” to “noisy” or “imbalanced” behavior. Combined with EP-RSI rolling over from an extreme or divergence labels appearing nearby, such clusters can highlight high-value inflection areas.
⚪ Overview Panel
Use the right-hand dashboard as a quick alignment guide rather than a direct signal generator. Each row represents a different structural component of the market, and each column represents a timeframe from 5M to 1D. The Signals row shows immediate directional bias, OB/OS highlights stretched conditions, Divergence marks structural disagreement, Impulse reveals bursts of momentum, Inefficiency identifies unstable movement and Explosive highlights higher-timeframe volatility conditions.
The panel is most useful as a mental checklist. When several timeframes show similar characteristics, such as multiple signals pointing in the same direction or impulses aligning across the lower timeframes, the context for the trade becomes stronger. Mixed readings indicate hesitation or imbalance in the market, helping you avoid forcing trades during unclear conditions.
With coverage across 5M, 15M, 1H, 2H, 4H and 1D, the dashboard gives you an instant sense of whether momentum, pressure and structure are working together or pushing against each other, allowing you to judge at a glance whether the environment favors continuation, rotation or caution.
█ How It Works
⚪ EP Source and Pre-EP Layer
The system begins by selecting a core behavioral driver such as Close, Mean-Reversion, or Trend. This source is transformed into a stability-aware stream that evaluates how consistently the price is moving relative to its own volatility environment. Each movement is weighted by its structural quality rather than raw magnitude, producing a preliminary Efficient Price that reflects directional reliability instead of noise.
- Calculation: Applies efficiency-based weighting and volatility normalization to the raw source, accumulating the results into a first-stage Efficient Price that represents structural strength and directional quality.
⚪ Main EP Engine and Adaptive Refinement
This first-stage Efficient Price is processed again through a second refinement pass, smoothing irregularities and further aligning the trajectory with coherent directional flow. The result is a fully refined Efficient Price that responds to meaningful structural shifts while avoiding the instability of raw price oscillation.
- Calculation: Uses a second adaptive efficiency pass with volatility moderation, cumulative weighting, and slope extraction. This acts as a two-layer filter, favoring persistent movement while remaining sensitive to regime changes.
⚪ Inefficiency–Trend Blending
This component evaluates the EP-RSI through two behavioral lenses: inefficiency and trend. Inefficiency highlights spike-driven, imbalanced movement, while the trend component captures underlying directional slope and stability. A smooth blending mechanism transitions between these modes depending on where the system sits within efficiency space.
- Calculation: Computes an inefficiency score from ER deviation and a trend score from normalized regression slope. A smoothstep transition blends them, and diamond markers appear when the oscillator confirms it is inside an inefficiency regime.
⚪ Momentum Impulse Modeling
Momentum impulses isolate moments when acceleration becomes unusually strong. The system exaggerates extreme RSI deviations while muting ordinary fluctuations, allowing only the sharpest bursts to stand out. A small clustering check eliminates transient noise, marking impulses only when structurally meaningful.
- Calculation: Runs RSI through chained non-linear transforms, compares outputs against their own historical envelopes, evaluates local dominance, and emits impulse markers when deviations exceed cluster thresholds.
-----------------
Disclaimer
The content provided in my scripts, indicators, ideas, algorithms, and systems is for educational and informational purposes only. It does not constitute financial advice, investment recommendations, or a solicitation to buy or sell any financial instruments. I will not accept liability for any loss or damage, including without limitation any loss of profit, which may arise directly or indirectly from the use of or reliance on such information.
All investments involve risk, and the past performance of a security, industry, sector, market, financial product, trading strategy, backtest, or individual's trading does not guarantee future results or returns. Investors are fully responsible for any investment decisions they make. Such decisions should be based solely on an evaluation of their financial circumstances, investment objectives, risk tolerance, and liquidity needs.
版本注释
Major Improvements! - The setting panel is more convenient.
- Trend RSI is added.
- Trend RSI signals are added.
Best
版本注释
Minor Update!Best
版本注释
Improvements! - RSI Signals with Alerts Added!
版本注释
Improvements- Performance improvements
- Enhanced setting panel
- Tooltips added
版本注释
Precision Added版本注释
minor change版本注释
Improvements! - Dynamic and Trend Cloud added
- Performance improvements
版本注释
Improvements!- Minor changes
版本注释
Performance improvements across the Efficient Price engine, Significant RSI Moves, Divergence Engine, Inefficiency Layer, and Momentum Impulse System, resulting in faster, smoother, and more accurate RSI signals.版本注释
minor fix仅限邀请脚本
只有作者授权的用户才能访问此脚本。您需要申请并获得使用许可。通常情况下,付款后即可获得许可。更多详情,请按照下方作者的说明操作,或直接联系Zeiierman。
TradingView不建议您付费购买或使用任何脚本,除非您完全信任其作者并了解其工作原理。您也可以在我们的社区脚本找到免费的开源替代方案。
作者的说明
Get instant access here: https://www.zeiierman.com/
Access my indicators at: zeiierman.com
Join Our Free Discord: discord.gg/zeiiermantrading
Join Our Free Discord: discord.gg/zeiiermantrading
免责声明
这些信息和出版物并非旨在提供,也不构成TradingView提供或认可的任何形式的财务、投资、交易或其他类型的建议或推荐。请阅读使用条款了解更多信息。
仅限邀请脚本
只有作者授权的用户才能访问此脚本。您需要申请并获得使用许可。通常情况下,付款后即可获得许可。更多详情,请按照下方作者的说明操作,或直接联系Zeiierman。
TradingView不建议您付费购买或使用任何脚本,除非您完全信任其作者并了解其工作原理。您也可以在我们的社区脚本找到免费的开源替代方案。
作者的说明
Get instant access here: https://www.zeiierman.com/
Access my indicators at: zeiierman.com
Join Our Free Discord: discord.gg/zeiiermantrading
Join Our Free Discord: discord.gg/zeiiermantrading
免责声明
这些信息和出版物并非旨在提供,也不构成TradingView提供或认可的任何形式的财务、投资、交易或其他类型的建议或推荐。请阅读使用条款了解更多信息。