PROTECTED SOURCE SCRIPT
已更新 US Recessions with SPX reversals v3 [FornaxTV]
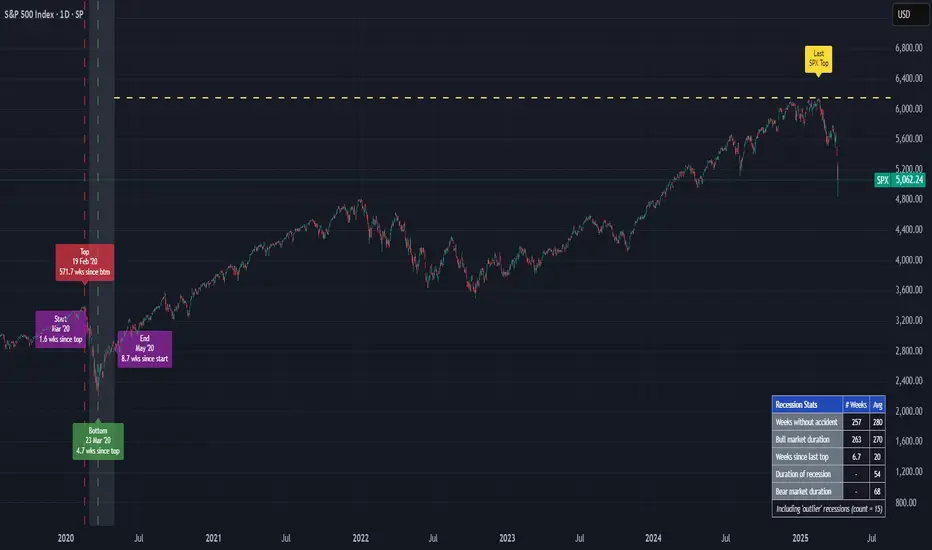
In addition to highlighting periods of official US recessions (as defined by the NBER) this script also displays vertical lines for the SPX market top and bottom associated with each recession.
This facilitates more detailed analysis of potential leading and coincident indicators for market tops and bottoms. This is particularly relevant for market tops, which typically precede the start of a recession by several months.
In addition to recessions with SPX market tops and market bottoms:
- A horizontal line can optionally be displayed for the last market top. (NOTE: this line will only be displayed for SPX tickers.)
- Labels can optionally be displayed for market tops & bottoms, plus the start and end of recessions. If the statistics are enabled (see below) these labels will also indicate the number of weeks between key market events, e.g. a market top and the start of a recession.
- A statistics table can optionally be displayed, contained statistics such as the number of weeks wince the last recession & market bottom, as well as averages for all recessions included in the analysis set.
For the recession statistics:
- "Outlier" recessions such as 1945 (WWII, where the market top occurred well after the recession itself) and 2020 (COVID pandemic, which was arguably not a "true" economic recession) can optionally be excluded.
- You can choose to exclude recessions occurring before a specific year.
版本注释
Fixed issue with "Last SPX Top" label display版本注释
Minor improvements to the (optional) summary table. All stats will be highlighted yellow if the current value exceeds the historical average, or red if the current value exceeds the historical average by more than 10%.受保护脚本
此脚本以闭源形式发布。 但是,您可以自由使用,没有任何限制 — 了解更多信息这里。
免责声明
这些信息和出版物并非旨在提供,也不构成TradingView提供或认可的任何形式的财务、投资、交易或其他类型的建议或推荐。请阅读使用条款了解更多信息。
免责声明
这些信息和出版物并非旨在提供,也不构成TradingView提供或认可的任何形式的财务、投资、交易或其他类型的建议或推荐。请阅读使用条款了解更多信息。