OPEN-SOURCE SCRIPT
Shock Detector: Price Jerk with Std-Dev Bands
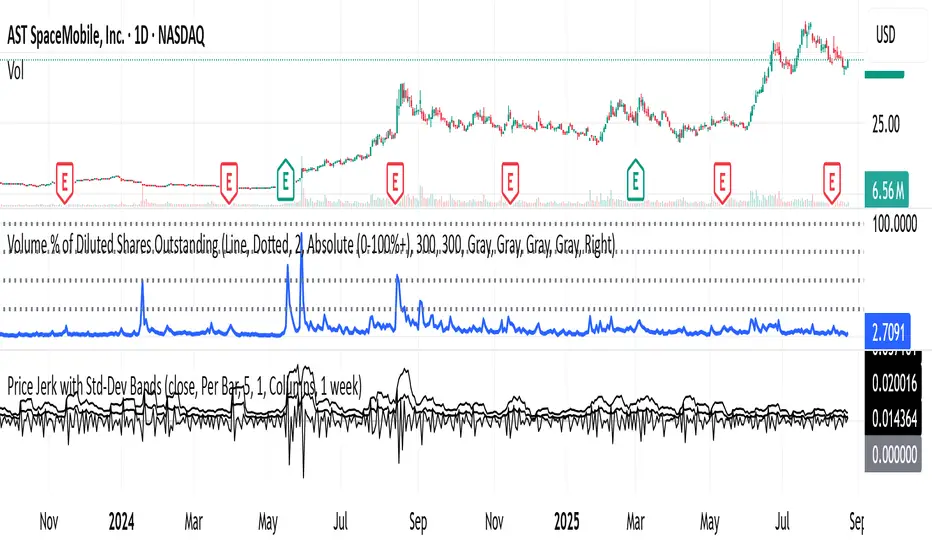
Detect sudden shocks in market behaviour
This indicator measures the jerk of price – the third derivative of price with respect to time (rate of change of acceleration). It highlights sudden accelerations and decelerations in price movement that are often invisible with standard momentum or volatility indicators.
Per-bar or time-scaled derivatives (choose whether calculations are based on bars or actual seconds).
Features
Log-price option for more stable readings across different price levels.
Optional smoothing with EMA to reduce noise.
Line or column view for flexible visualization.
Standard deviation bands (±1σ and ±2σ), centered either on zero or the rolling mean.
Auto window selection (1 day to 4 weeks), adaptive to chart timeframe.
Color-coded jerk: green for positive, red for negative.
Optional filled bands for easy visual context of normal vs. extreme jerk moves.
How to Use
Use jerk to identify sudden shifts in market dynamics, where price movement is not just changing direction but changing its acceleration.
Bands help highlight when jerk values are statistically unusual compared to recent history.
Combine with trend or momentum indicators for potential early warning of breakouts, reversals, or exhaustion.
Why it’s useful
Most indicators measure price, velocity (returns), or acceleration (momentum). This goes one step further to look at jerk, giving you a tool to spot “shock” movements in the market. By framing jerk within standard deviation bands, it’s easy to see whether current moves are ordinary or exceptional.
Developed with the assistance of ChatGPT (OpenAI).
开源脚本
秉承TradingView的精神,该脚本的作者将其开源,以便交易者可以查看和验证其功能。向作者致敬!您可以免费使用该脚本,但请记住,重新发布代码须遵守我们的网站规则。
免责声明
这些信息和出版物并非旨在提供,也不构成TradingView提供或认可的任何形式的财务、投资、交易或其他类型的建议或推荐。请阅读使用条款了解更多信息。
免责声明
这些信息和出版物并非旨在提供,也不构成TradingView提供或认可的任何形式的财务、投资、交易或其他类型的建议或推荐。请阅读使用条款了解更多信息。