OPEN-SOURCE SCRIPT
已更新 Squeeze Breakout using BB and KC [v1.0][Bishnu103]

Squeeze Breakout using BB and KC [v1.0][Bishnu103]
版本注释
Squeeze Breakout using BB and KC [v1.0][Bishnu103]版本注释
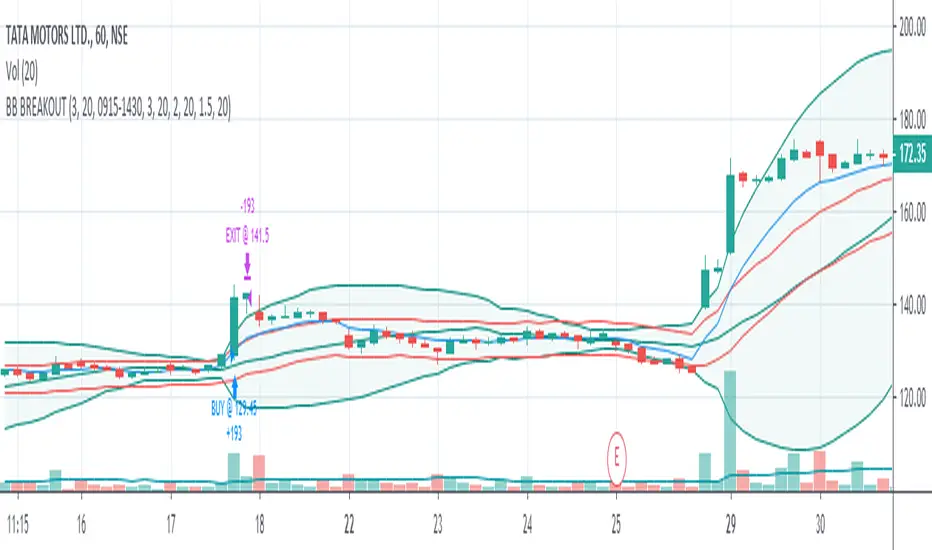
Strategy:- Instrument trading in a narrow range or in a squeeze. Bollinger Band width is narrow. Bollinger Band is within Keltner Channel.
Enter long when price goes up with increased volatility and volume.A candle closed above Upper Bollinger Band (alert candle). Entry above high of the alert candle. Volume is high.
Enter short when price goes down with increased volatility and volume. A candle closed above Lower Bollinger Band (alert candle). Entry below low of the alert candle. Volume is high.
Fixed stop loss to protect the trade from sudden movement. Below middle BB for long. Above middle BB for short.
Moving stop loss to exit when the momentum slows down or turns back. Exit a long trade in profit or loss when a candle closes below 8 EMA and price goes below low of that candle. Exit a short trade in profit or loss when a candle closes above 8 EMA and price goes above high of that candle.
Indicator Used:
- Bollinger Band and ATR to define low volatility and squeeze.
Keltner Channel to define the quality of the squeeze.
8EMA as moving stop loss.
EMAs (8, 21, 34, 55, 89) to define trend.
200ma to define trend.
Controls:
- Various controls of the strategy offers a flexibility to create various combination of key aspects and indicators along with parameters. User can change these values to find the winning combination appropriate to the timeframe and type of market. It can be used with all timeframes.
BB Squeeze Check: When this option is checked, strategy will check if BB currently in squeeze or not. It uses ATR along with BB to perform this check.
BB Squeeze Width: It’s numeric value to define squeeze width. Lesser the number, better the squeeze is.
BB Within KC Check: When this option is checked, strategy will check if the BB is within KC at least one side (upper/ lower side) for last 6 candles. This ensures that the squeeze is good or volatility less.
EMA Trend Check: When this option is checked, strategy will check if 8EMA > 21EMA > 34EMA > 55EMA > 89 EMA for long and 8EMA < 21EMA < 34EMA < 55EMA < 89 EMA for short. This ensures that the instrument is bullish or bearish in higher timeframe compared to the current timeframe.
200MA Trend Check: When this is checked, strategy will look for only long trades if price is above and near to 200MA and only short trades if price is below and near to 200MA.
Average Volume Check: When this option is checked, strategy will check if volume of current candle or alert candle is more than average volume.
No Of Bars For Volume Check: This is the number to set number of candles to use for average volume calculation.
Buy Session: Valid only if resolution (timeframe) is intraday, i.e. less than daily candle. It helps to limit buy signals during the specified timeframe.
Exit Intraday: To be used only for Indian market. When this option is checked, strategy will exit the trade 3:16pm. This will be enhanced later to provide more flexibility.
Entry Distance From Alert: This is to set the number of candles to wait after the alert candle for order trigger. E.g. if this is set to 5, strategy will wait for next 5 candles to break high (for long) or low (for short) of the alert candle. If the entry level is broken after 5 candles then order will not be triggered.
Show BB: To display BB on chart.
Show KC: To display KC on chart.
Show 8EMA: To display 8EMA on chart.
Show EMAs: To display EMAs (8, 21, 34, 55, 89) on chart.
BB Length: Lookback period for BB.
BB StdDev: Standard deviation to be used for BB.
KC Length: Lookback period for KC.
KC Mult: Multiplier to be used for KC.
ATR Length: Lookback period for ATR.
版本注释
There was an issue with intraday exit feature due to which it was not working on timeframes other than 15 min. Now it is resolved. It should work fine now for minutes and hourly timeframes if exit intraday option is marked. 开源脚本
秉承TradingView的精神,该脚本的作者将其开源,以便交易者可以查看和验证其功能。向作者致敬!您可以免费使用该脚本,但请记住,重新发布代码须遵守我们的网站规则。
免责声明
这些信息和出版物并非旨在提供,也不构成TradingView提供或认可的任何形式的财务、投资、交易或其他类型的建议或推荐。请阅读使用条款了解更多信息。
开源脚本
秉承TradingView的精神,该脚本的作者将其开源,以便交易者可以查看和验证其功能。向作者致敬!您可以免费使用该脚本,但请记住,重新发布代码须遵守我们的网站规则。
免责声明
这些信息和出版物并非旨在提供,也不构成TradingView提供或认可的任何形式的财务、投资、交易或其他类型的建议或推荐。请阅读使用条款了解更多信息。