OPEN-SOURCE SCRIPT
已更新 Blood Moons
Blood Moon Dates
Description:
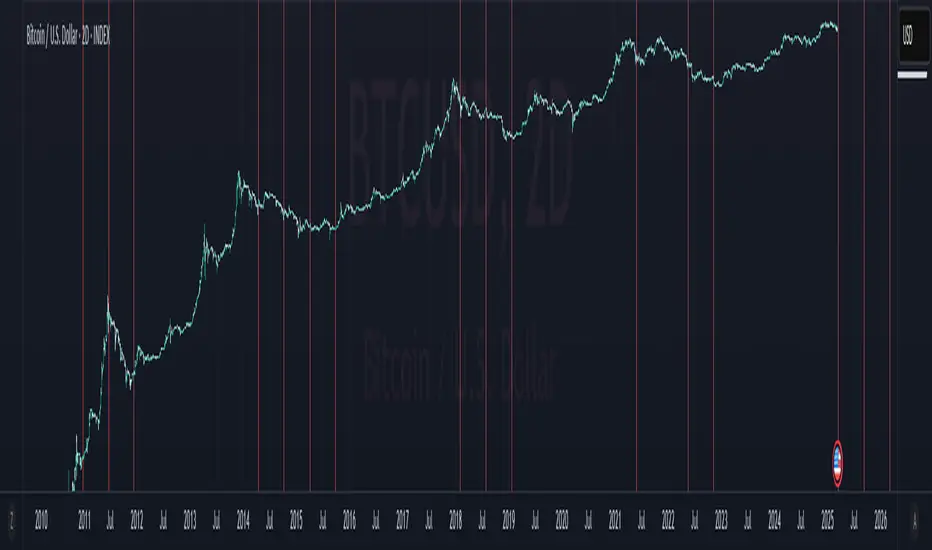
This indicator overlays vertical lines on your chart to mark the dates of total lunar eclipses (commonly known as "Blood Moons") from December 2010 to May 2040. Designed with cryptocurrency traders in mind, it’s perfect for analyzing potential correlations between these celestial events and price movements. The lines are drawn on the first bar and extend across the chart, making it easy to spot these dates on any timeframe.
Features:
Plots vertical lines for 19 Blood Moon events (2010–2040).
Customizable line color, style (solid, dotted, dashed), and width.
Option to toggle lines on/off for a cleaner chart.
Lines extend both ways for maximum visibility across your chart.
Settings:
Show Lines: Enable or disable the lines (default: enabled).
Line Color: Choose your preferred color (default: red).
Line Style: Select solid, dotted, or dashed (default: dotted).
Line Width: Adjust thickness from 1 to 5 (default: 2).
Usage:
Add this indicator to your chart to visualize Blood Moon dates alongside price action. Customize the appearance to suit your analysis style. Note: Lines are plotted based on timestamps and extend across the chart, so they’re best viewed on daily or higher timeframes for clarity.
Disclaimer:
This is an educational tool and not financial advice. Past performance does not guarantee future results. Use at your own risk.
Description:
This indicator overlays vertical lines on your chart to mark the dates of total lunar eclipses (commonly known as "Blood Moons") from December 2010 to May 2040. Designed with cryptocurrency traders in mind, it’s perfect for analyzing potential correlations between these celestial events and price movements. The lines are drawn on the first bar and extend across the chart, making it easy to spot these dates on any timeframe.
Features:
Plots vertical lines for 19 Blood Moon events (2010–2040).
Customizable line color, style (solid, dotted, dashed), and width.
Option to toggle lines on/off for a cleaner chart.
Lines extend both ways for maximum visibility across your chart.
Settings:
Show Lines: Enable or disable the lines (default: enabled).
Line Color: Choose your preferred color (default: red).
Line Style: Select solid, dotted, or dashed (default: dotted).
Line Width: Adjust thickness from 1 to 5 (default: 2).
Usage:
Add this indicator to your chart to visualize Blood Moon dates alongside price action. Customize the appearance to suit your analysis style. Note: Lines are plotted based on timestamps and extend across the chart, so they’re best viewed on daily or higher timeframes for clarity.
Disclaimer:
This is an educational tool and not financial advice. Past performance does not guarantee future results. Use at your own risk.
版本注释
quality of life with auto scaling issueswould prefer vertical lines but pinescript is too picky with those
opting for shapes instead
版本注释
script name fix from BM Balls to Blood Moons版本注释
fixed bugwill have to check in a couple days whether that blood moon date prints a shape
版本注释
updating default color/transp版本注释
reverting to near original, pinescript sucks btw版本注释
updated future dates开源脚本
秉承TradingView的精神,该脚本的作者将其开源,以便交易者可以查看和验证其功能。向作者致敬!您可以免费使用该脚本,但请记住,重新发布代码须遵守我们的网站规则。
免责声明
这些信息和出版物并非旨在提供,也不构成TradingView提供或认可的任何形式的财务、投资、交易或其他类型的建议或推荐。请阅读使用条款了解更多信息。
开源脚本
秉承TradingView的精神,该脚本的作者将其开源,以便交易者可以查看和验证其功能。向作者致敬!您可以免费使用该脚本,但请记住,重新发布代码须遵守我们的网站规则。
免责声明
这些信息和出版物并非旨在提供,也不构成TradingView提供或认可的任何形式的财务、投资、交易或其他类型的建议或推荐。请阅读使用条款了解更多信息。