PROTECTED SOURCE SCRIPT
已更新 [killerbee] MTF Retracement
Key Features
Multi-Timeframe (MTF) Analysis: Plot the high, low, and open from up to four user-defined higher timeframes. This allows you to see the bigger picture and identify key levels that institutional traders are watching.
Dynamic Support & Resistance: Lines are drawn at these key MTF levels and extend until price breaks through them, providing a clean and dynamic view of support and resistance.
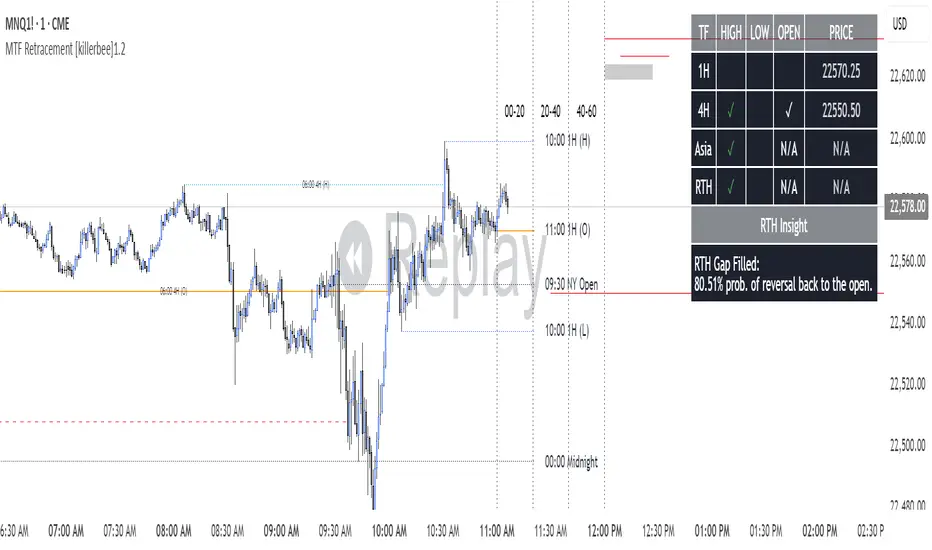
Session Highlighting: Automatically draw boxes and high/low lines for the Asia, London, and RTH (Regular Trading Hours) sessions. This helps you understand the context of price action throughout the trading day.
Customizable Opening Price Lines: Pinpoint significant opening prices with dedicated lines for events like the "Midnight Open," "8:30 Open," and "9:30 Open."
"NQ STATS TABLE": A powerful statistical table that provides real-time insights:
Break/Hit Confirmation: Instantly see when a key MTF high/low has been broken or when an opening price has been retraced to.
9 AM Directional Bias: A bullish or bearish bias based on the close of the 9 AM (New York time) hourly candle.
Historical Probabilities: The table displays historical probabilities for price to either break a previous high/low or retrace to the open, based on the current hour of the trading session.
Extensive Customization: Nearly every visual aspect of the indicator can be customized to your preference, including colors, line styles, visibility of each component, and the position of the stats table.
How to Use
Identify Key Levels: The lines from the higher timeframes (HTF1, HTF2, etc.) represent significant support and resistance. Pay close attention to these levels as price approaches them.
Look for Breaks and Retracements:
When a high or low line is broken, the line will stop extending. This can signal a shift in market structure and a potential continuation in the direction of the break.
The "Open Line" for each timeframe represents the opening price. When the line stops extending, it means price has retraced back to that open, a common occurrence in the market.
Utilize the Sessions:
The Asia, London, and RTH boxes help you frame your trading day. The highs and lows of these sessions are often critical levels of support and resistance.
Breakouts from these session ranges can lead to strong directional moves.
Leverage the STATS TABLE:
Use the "Break" and "Hit" columns to quickly confirm when key levels have been breached or revisited.
The "Direction" row gives you a quick sentiment reading based on the 9 AM candle.
The "Trades Back %" and "High/Low Forms" provide a statistical edge by showing you the historical likelihood of certain price behaviors based on the time of day. This can help you decide whether to play for a breakout or a retracement.
Multi-Timeframe (MTF) Analysis: Plot the high, low, and open from up to four user-defined higher timeframes. This allows you to see the bigger picture and identify key levels that institutional traders are watching.
Dynamic Support & Resistance: Lines are drawn at these key MTF levels and extend until price breaks through them, providing a clean and dynamic view of support and resistance.
Session Highlighting: Automatically draw boxes and high/low lines for the Asia, London, and RTH (Regular Trading Hours) sessions. This helps you understand the context of price action throughout the trading day.
Customizable Opening Price Lines: Pinpoint significant opening prices with dedicated lines for events like the "Midnight Open," "8:30 Open," and "9:30 Open."
"NQ STATS TABLE": A powerful statistical table that provides real-time insights:
Break/Hit Confirmation: Instantly see when a key MTF high/low has been broken or when an opening price has been retraced to.
9 AM Directional Bias: A bullish or bearish bias based on the close of the 9 AM (New York time) hourly candle.
Historical Probabilities: The table displays historical probabilities for price to either break a previous high/low or retrace to the open, based on the current hour of the trading session.
Extensive Customization: Nearly every visual aspect of the indicator can be customized to your preference, including colors, line styles, visibility of each component, and the position of the stats table.
How to Use
Identify Key Levels: The lines from the higher timeframes (HTF1, HTF2, etc.) represent significant support and resistance. Pay close attention to these levels as price approaches them.
Look for Breaks and Retracements:
When a high or low line is broken, the line will stop extending. This can signal a shift in market structure and a potential continuation in the direction of the break.
The "Open Line" for each timeframe represents the opening price. When the line stops extending, it means price has retraced back to that open, a common occurrence in the market.
Utilize the Sessions:
The Asia, London, and RTH boxes help you frame your trading day. The highs and lows of these sessions are often critical levels of support and resistance.
Breakouts from these session ranges can lead to strong directional moves.
Leverage the STATS TABLE:
Use the "Break" and "Hit" columns to quickly confirm when key levels have been breached or revisited.
The "Direction" row gives you a quick sentiment reading based on the 9 AM candle.
The "Trades Back %" and "High/Low Forms" provide a statistical edge by showing you the historical likelihood of certain price behaviors based on the time of day. This can help you decide whether to play for a breakout or a retracement.
版本注释
-update. Fixed when table check marks didn't work with lines off,版本注释
-update: fixed table issues where the color changed on the second break. 版本注释
-updated name版本注释
- fixed label bug, offset open time label was wrong and the timeframe name labels were missing版本注释
- major changes to the backend - now like labels can be combined to a single line, Cleaned up the table and data to make it easier to read, added dark mode for the table, Added 1 extra session and 1 extra keylevel time. 版本注释
- added option in settings to hide the table row if both the High and Low have been swept to keep the table more relevant. 版本注释
1.2 - Added vertical Hourly future lines and labels w/ settings- fixed a table issue when no timeframes where turned on
受保护脚本
此脚本以闭源形式发布。 但是,您可以自由使用,没有任何限制 — 了解更多信息这里。
免责声明
这些信息和出版物并非旨在提供,也不构成TradingView提供或认可的任何形式的财务、投资、交易或其他类型的建议或推荐。请阅读使用条款了解更多信息。
受保护脚本
此脚本以闭源形式发布。 但是,您可以自由使用,没有任何限制 — 了解更多信息这里。
免责声明
这些信息和出版物并非旨在提供,也不构成TradingView提供或认可的任何形式的财务、投资、交易或其他类型的建议或推荐。请阅读使用条款了解更多信息。