PROTECTED SOURCE SCRIPT
已更新 TH-Long & Short
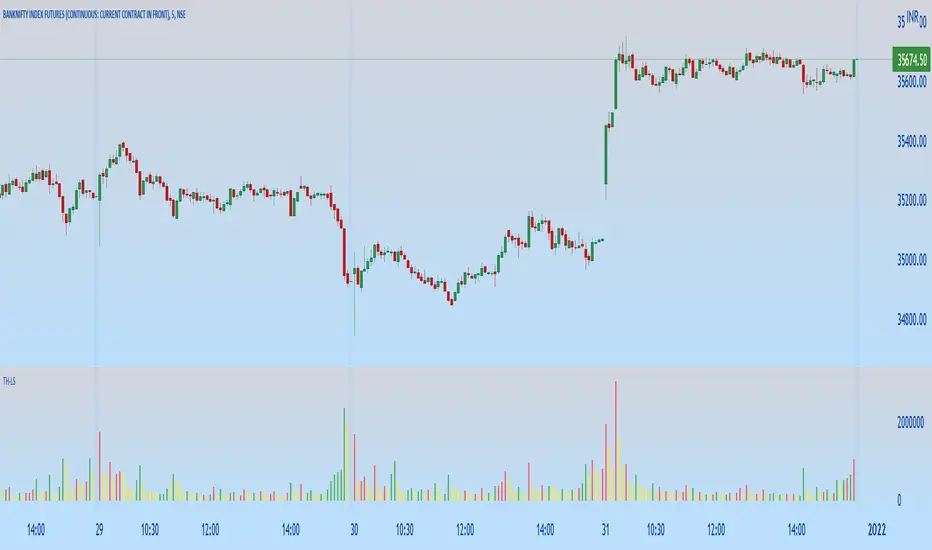
This indicator will help in identifying the reference candles for taking entry into the trade.
These reference candles are been named as LONG & SHORT Candles for easy understanding.
LONG Volume Candles - are reference candle for taking long positions.
SHORT Volume Candles - are reference candle for taking short positions.
Color Coding of Volume Candles:
LONG CANDLES - GREEN
SHORT CANDLES - RED
NEUTRAL CANDLES - YELLOW
LOGIC behind this implementation:
LONG candle:
In order to take long position we need to identify the price level, wherein we can anticipate the price is likely to get reversed along with increase in volume w.r.t previous candle.
Once this identified candle high price is taken out by any consecutive candles on closing basis, we get more confirmation of possible bullish price reversal. Hence the indicator tries to mark those volume candles as LONG candles (Green) where in the volume has increased from the previous candle along with the price increase on upper side.
SHORT candle:
In order to take short position we need to identify the price level, wherein we can anticipate the price is likely to get reversed along with increase in volume w.r.t previous candle.
Once this identified candle low price is taken out by any consecutive candles on closing basis, we get more confirmation of possible bearish price reversal. Hence the indicator tries to mark those volume candles as SHORT candles (Red) where in the volume has increased from the previous candle along with the price decrease on lower side.
NEUTRAL candle:
The price are trading in a range with no significant change in volumes too, these candles can be ignored as possible triggers for position entry. The indicator marks these volume candle as NEUTRAL candles (Yellow) which can be ignored.
HOW TO USE THIS INDICATOR:
First & more most this is not a buy/sell kind of indicator. As explained earlier, they help in identifying the possible price reversals.
We need to first identify your supply and demand zones and then use these signals as an extra confirmation for taking positions.
LONG Positions:
Wait for possible green volume candle formation, once formed mark the high of the corresponding price candle. On breach of that price on closing basis by any consecutive candle, we can look for possible long position.
SHORT Positions:
Wait for possible red volume candle formation, once formed mark the low of the corresponding price candle. On breach of that price on closing basis by any consecutive candle, we can look for possible Short position.
Friends,do use the indicator and give your valuable feedback.
版本注释
Updated to customize the colors.版本注释
Updated to version 5受保护脚本
此脚本以闭源形式发布。 但是,您可以自由使用,没有任何限制 — 了解更多信息这里。
Subscribe the indicator at igcyh.courses.store/
免责声明
这些信息和出版物并非旨在提供,也不构成TradingView提供或认可的任何形式的财务、投资、交易或其他类型的建议或推荐。请阅读使用条款了解更多信息。
受保护脚本
此脚本以闭源形式发布。 但是,您可以自由使用,没有任何限制 — 了解更多信息这里。
Subscribe the indicator at igcyh.courses.store/
免责声明
这些信息和出版物并非旨在提供,也不构成TradingView提供或认可的任何形式的财务、投资、交易或其他类型的建议或推荐。请阅读使用条款了解更多信息。