OPEN-SOURCE SCRIPT
Logarithmic Bollinger Bands
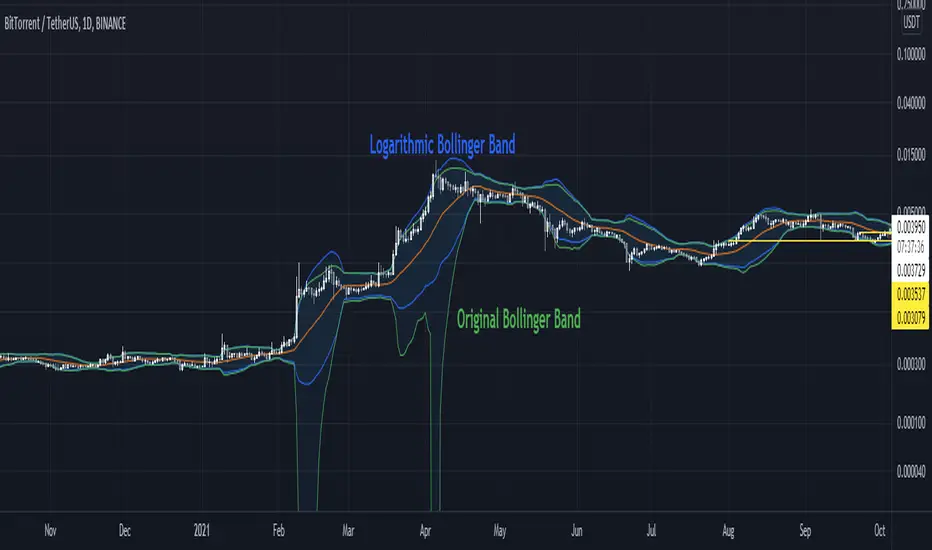
The existing Bollinger Bands simply used price to derive the standard deviation.
In other words, whether an asset goes up or down by $50 from $100, it counts at the same "50$".
But in the asset market, an increase of $50 and a fall of $50 have different values.
To eliminate this difference using a logarithmic function, a new Bollinger Band was created.
Green is the original Bollinger Band.
As mentioned above, a sharp lower band is formed by calculating the rise and fall of an asset with the same value.
Blue is the Logarithmic Bollinger band.
Please make this indicator useful!
기존의 볼린저 밴드는 단순하게 가격을 이용해 표준편차를 도출해내었습니다.
즉 자산이 100$에서 50$이 오르든 내리든 같은 "50$"로 계산한 것입니다.
하지만 자산시장에서 50$이 오르는 것과 50$이 내리는 것은 다른 가치를 가집니다.
이 차이를 로그함수를 이용해 없애보고자 하였고, 새로운 볼린저밴드를 만들었습니다.
초록색이 기존의 볼린저밴드입니다.
위에서 말했듯이 자산의 오르내림을 같은 가치로 계산해서 급격한 아래 밴드가 형성됩니다.
파란색이 로그 볼린저밴드입니다.
이 지표를 유용하게 사용해주세요!
开源脚本
秉承TradingView的精神,该脚本的作者将其开源,以便交易者可以查看和验证其功能。向作者致敬!您可以免费使用该脚本,但请记住,重新发布代码须遵守我们的网站规则。
免责声明
这些信息和出版物并非旨在提供,也不构成TradingView提供或认可的任何形式的财务、投资、交易或其他类型的建议或推荐。请阅读使用条款了解更多信息。
开源脚本
秉承TradingView的精神,该脚本的作者将其开源,以便交易者可以查看和验证其功能。向作者致敬!您可以免费使用该脚本,但请记住,重新发布代码须遵守我们的网站规则。
免责声明
这些信息和出版物并非旨在提供,也不构成TradingView提供或认可的任何形式的财务、投资、交易或其他类型的建议或推荐。请阅读使用条款了解更多信息。