INVITE-ONLY SCRIPT
已更新 (CM|DB) Caruso Market Dashboard
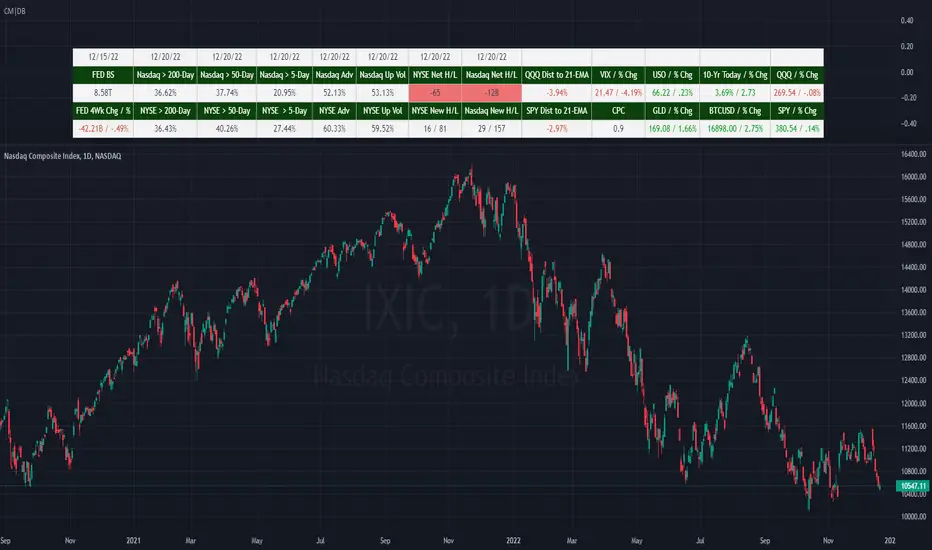
The Caruso Market Dashboard (CM|DB) provides a snapshot of key US market data, market internals (breadth), and economic statistics. It displays real-time prices of seven major markets along with daily updates of the put/call ratio and multiple breadth measurements. Lastly, it displays the Federal Reserve’s balance sheet and 4-week change of assets held to help investors keep abreast of important FED changes in policy.
Presented for both the Nasdaq and NYSE composites and updated at the end of each trading day, the market breadth section shows:
· the number of net 52-week highs and lows
· the actual number of new 52-week highs and 52-week lows.
· The percentage of volume traded on up stocks vs. total volume
· The percentage of stocks advancing vs. all stocks
· Percentage of stocks above their 5-day average
· Percentage of stocks above their 50-day average
· Percentage of stocks above their 200-day average
In addition to presenting all of this valuable information in a table, users can hide the table and plot each market and economic data point. This is very helpful when viewing trends as well as overbought and oversold levels for these data points.
版本注释
Version 2.0■ Intraday support.
■ Add option to change market data symbols.
版本注释
Bug Fix■ The SPY cell now correctly displays text green or red depending on the daily change.
■ New symbol names now display correctly if the dashboard's breadth stats are not shown
仅限邀请脚本
只有作者授权的用户才能访问此脚本。您需要申请并获得使用许可。通常情况下,付款后即可获得许可。更多详情,请按照下方作者的说明操作,或直接联系CarusoInsights。
TradingView不建议您付费购买或使用任何脚本,除非您完全信任其作者并了解其工作原理。您也可以在我们的社区脚本找到免费的开源替代方案。
作者的说明
Get access to CarusoInsights indicators: https://www.carusoinsights.com/charting/
Get access to CarusoInsights indicators: carusoinsights.com/charting/
免责声明
这些信息和出版物并非旨在提供,也不构成TradingView提供或认可的任何形式的财务、投资、交易或其他类型的建议或推荐。请阅读使用条款了解更多信息。