OPEN-SOURCE SCRIPT
BeautifulStochRSI
BeautifulStochRSI: A Unique and Clear Approach to Stochastic RSI
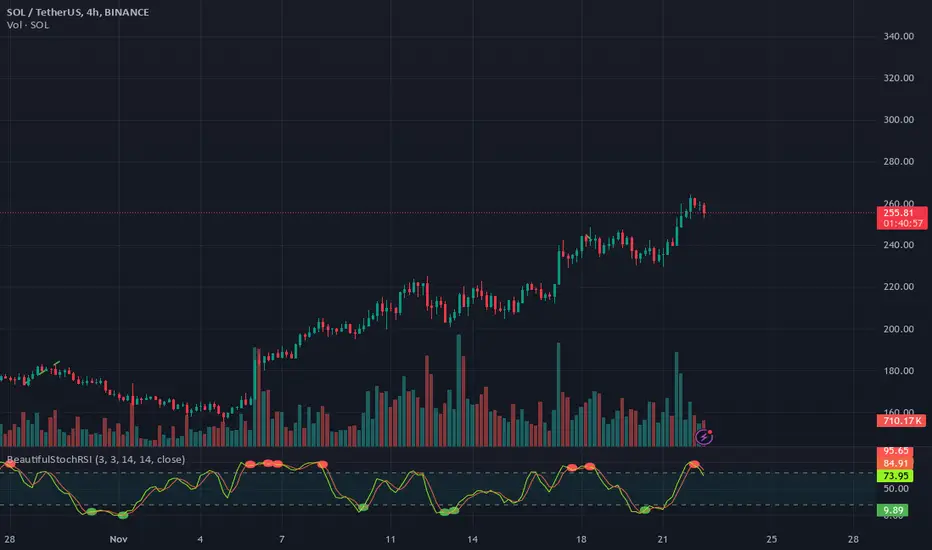
Introducing the BeautifulStochRSI, an colorfull approach to the popular Stochastic RSI indicator. This script goes beyond the standard representation by offering visually distinct and intuitive signals to enhance your trading experience.
The BeautifulStochRSI is ideal for traders who value both precision and simplicity. It combines functional enhancements with a polished design, ensuring that crucial market insights are presented clearly and effectively. Created by rektbyhielke, this script leverages the capabilities of Pine Script™ v5 for optimal performance.
By sharing this script, the aim is not only to provide a practical trading solution but also to inspire others to create indicators that are both beautiful and efficient.
the script includes fully customizable parameters for RSI length, stochastic length, and smoothing factors, allowing traders to tailor the indicator to their specific strategies. Overbought and oversold zones are marked with dots at levels 80 and 20, complemented by a subtle teal background fill to emphasize these areas.
开源脚本
秉承TradingView的精神,该脚本的作者将其开源,以便交易者可以查看和验证其功能。向作者致敬!您可以免费使用该脚本,但请记住,重新发布代码须遵守我们的网站规则。
免责声明
这些信息和出版物并非旨在提供,也不构成TradingView提供或认可的任何形式的财务、投资、交易或其他类型的建议或推荐。请阅读使用条款了解更多信息。
开源脚本
秉承TradingView的精神,该脚本的作者将其开源,以便交易者可以查看和验证其功能。向作者致敬!您可以免费使用该脚本,但请记住,重新发布代码须遵守我们的网站规则。
免责声明
这些信息和出版物并非旨在提供,也不构成TradingView提供或认可的任何形式的财务、投资、交易或其他类型的建议或推荐。请阅读使用条款了解更多信息。