INVITE-ONLY SCRIPT
(CF|DB) Caruso Financial Dashboard
已更新
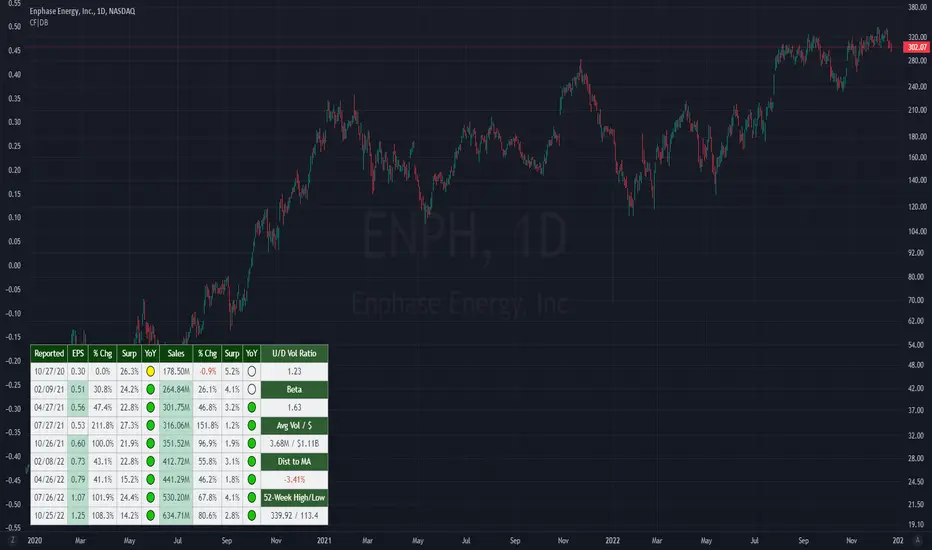
The Caruso Financial Dashboard brings a rich amount of company financial data straight to your TradingView chart along with additional vital stock-related information. At a glance, you can see EPS (Diluted), Sales, growth rates, and EPS/Sales surprises either quarter by quarter on the daily chart or for Fiscal Years on the weekly chart.
On the daily chart, the financial table also has helpful highlights to visually display if a quarter’s EPS or Sales are higher than the same quarter a year ago. Also, EPS and Sales data has a helpful green shading when a new record high number has been achieved for the metric. Additional stock-based metrics include the stock’s Up/Down volume ratio, Beta, Average Daily Volume in terms of shares traded or dollar value traded, the percentage distance to a moving average of choice, as well as the stock’s 52-week high and low.
The weekly chart shows financial data for fiscal years. It also has additional stock-based metrics from those available on the daily chart. These include; Market Cap, Shares in Float and the Float as a percentage of all shares outstanding, the distance from the stock’s 52-week high, the distance to a moving average of choice (10 sma by default), the P/E and P/S ratios.
To further help an investor understand a company’s growth rates, the CF|DB allows a user to hide all or part of the table and plot EPS, EPS TTM (Trailing Twelve Months), and Sales TTM lines on the chart. This can be applied to either the daily or weekly chart.
The CF|DB provides financial and market data for international markets (US, EU, Canada, Australia, Hong Kong, Japan, and more), making its applicability global.
Features On Daily Chart
· Quarterly EPS
· Quarterly EPS growth rate YoY
· Quarterly EPS Surprise vs consensus estimate
· Quarterly Sales
· Quarterly Sales growth rate YoY
· Quarterly Sales Surprise vs consensus estimate
· Green/Red dot highlighting YoY growth or decline
· EPS/Sales green highlight for 8 quarter high or record high numbers
· Up/Down Volume Ratio
· Beta
· Average Daily Volume (shares trade). Period for the average can be configured
· Average Daily Volume (dollar value traded). Period for the average can be configured
· Distance to a moving average. The average can be configured. 21 ema by default
· 52-week high and low
· New 52-week highs and lows are highlighted by a red or green box shading
· Ability to plot EPS, EPS TTM, Sales lines
· Ability to hide part or all of the financial data table
Features On Weekly Chart
· FY EPS
· FY EPS growth rate YoY
· FY EPS Surprise vs consensus estimate
· FY Sales
· FY Sales growth rate YoY
· FY Sales Surprise vs consensus estimate
· EPS/Sales green highlight for 8-year high or record high numbers
· Market Cap
· Shares in float
· Share in float as a percentage of all shares outstanding
· Distance to new 52-week highs
· Distance to a moving average. The average can be configured. 10 sma by default
· Ability to plot EPS, EPS TTM, Sales lines
· Ability to hide part or all of the financial data table
版本注释
Version 2.0■ Added an option to show a small margin on the top/bottom of the table so chart content is not obscured.
■ Updated TTM calculations.
仅限邀请脚本
仅限作者授权的用户访问此脚本,并且通常需要付费。您可以将其添加到收藏中,但是只有在向作者请求并获得许可之后,才能使用它。 请联系CarusoInsights了解更多信息,或按照以下作者的说明操作。
TradingView不建议付费使用脚本,除非您100%信任作者并了解脚本的工作原理。在许多情况下,您可以在我们的社区脚本免费找到不错的开源替代方案。
作者的说明
″Get access to CarusoInsights indicators: https://www.carusoinsights.com/charting/
想在图表上使用此脚本?
警告:请在申请访问权限之前阅读。
Get access to CarusoInsights indicators: carusoinsights.com/charting/
免责声明
这些信息和出版物并不意味着也不构成TradingView提供或认可的金融、投资、交易或其它类型的建议或背书。请在使用条款阅读更多信息。