OPEN-SOURCE SCRIPT
已更新 RSI+ Overbought/Sold Indicator
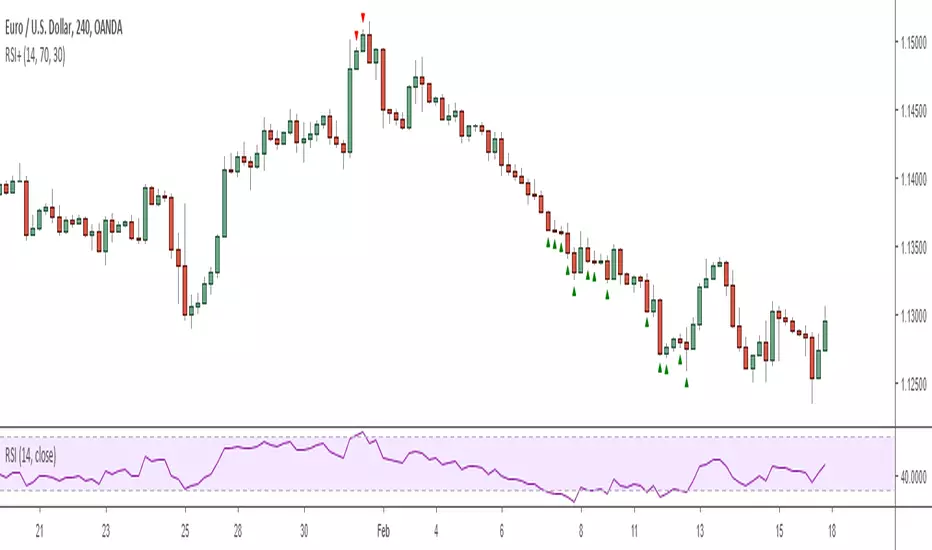
This is a very simple script that plots signals on the chart whenever the RSI crosses the given threshold. Nothing fancy, but it is useful for deciding when to exit trades or prepare for pullbacks or for confirming that the market is currently in the middle of an extremely impulsive move or trend. It has alert functionality and you can set the overbought/sold thresholds and RSI length in the options menu.
Note: I definitely wouldn't recommend using it to enter trades unless you're an experienced counter-trend trader :)
Regards -
Matt.
Note: I definitely wouldn't recommend using it to enter trades unless you're an experienced counter-trend trader :)
Regards -
Matt.
版本注释
Removed text labels to make indicator more subtle. Very useful as a background confirmation tool against support & resistance for counter-trend opportunities or for gauging momentum during over-extended pullbacks for trend-continuation opportunities.版本注释
-版本注释
Minor improvements版本注释
Updated to Pine Script v5开源脚本
秉承TradingView的精神,该脚本的作者将其开源,以便交易者可以查看和验证其功能。向作者致敬!您可以免费使用该脚本,但请记住,重新发布代码须遵守我们的网站规则。
My Resources Hub: theartoftrading.com
FREE YouTube Lessons: rebrand.ly/zyt
FREE Pine Script Basics Course: rebrand.ly/zpsbc
Pine Script MASTERY Course: rebrand.ly/zpsmc
My Indicators & Strategies: rebrand.ly/zmisc
FREE YouTube Lessons: rebrand.ly/zyt
FREE Pine Script Basics Course: rebrand.ly/zpsbc
Pine Script MASTERY Course: rebrand.ly/zpsmc
My Indicators & Strategies: rebrand.ly/zmisc
免责声明
这些信息和出版物并非旨在提供,也不构成TradingView提供或认可的任何形式的财务、投资、交易或其他类型的建议或推荐。请阅读使用条款了解更多信息。
开源脚本
秉承TradingView的精神,该脚本的作者将其开源,以便交易者可以查看和验证其功能。向作者致敬!您可以免费使用该脚本,但请记住,重新发布代码须遵守我们的网站规则。
My Resources Hub: theartoftrading.com
FREE YouTube Lessons: rebrand.ly/zyt
FREE Pine Script Basics Course: rebrand.ly/zpsbc
Pine Script MASTERY Course: rebrand.ly/zpsmc
My Indicators & Strategies: rebrand.ly/zmisc
FREE YouTube Lessons: rebrand.ly/zyt
FREE Pine Script Basics Course: rebrand.ly/zpsbc
Pine Script MASTERY Course: rebrand.ly/zpsmc
My Indicators & Strategies: rebrand.ly/zmisc
免责声明
这些信息和出版物并非旨在提供,也不构成TradingView提供或认可的任何形式的财务、投资、交易或其他类型的建议或推荐。请阅读使用条款了解更多信息。