OPEN-SOURCE SCRIPT
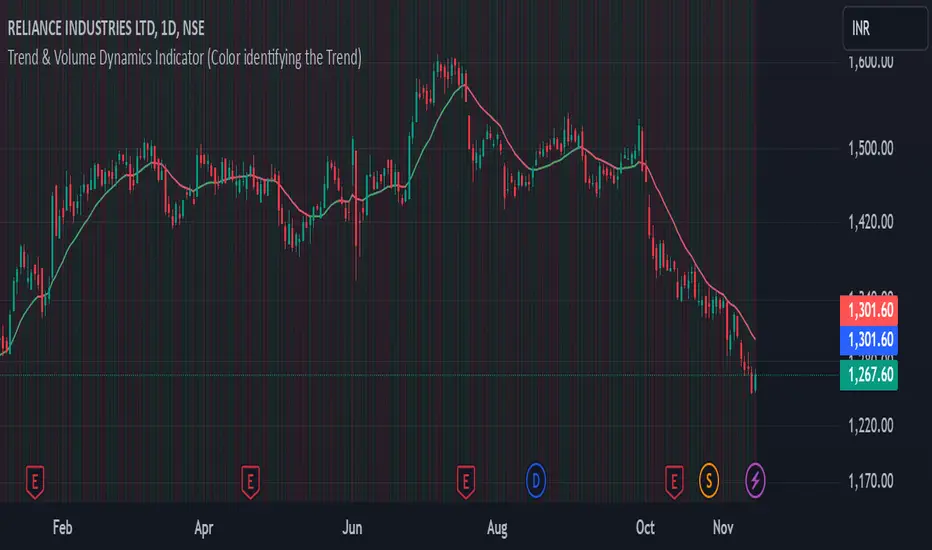
已更新 Trend & Volume Dynamics Indicator (Color identifying the Trend)
Benefits
1. Trend Identification:
o The script calculates a 20-period Weighted Moving Average (WMA) of the closing prices. This helps in smoothing out price data to identify the underlying trend.
o The color of the WMA line changes based on the price position relative to the WMA:
Green: When the current price is above the WMA, indicating a potential uptrend.
Red: When the current price is below the WMA, indicating a potential downtrend.
Blue: When the price is exactly at the WMA, indicating no clear trend.
2. Volume Dynamics:
o The script also plots the volume with a color-coding mechanism:
Green: When the current volume is higher than the previous period's volume, indicating increasing trading activity.
Red: When the current volume is lower than the previous period's volume, indicating decreasing trading activity.
o The volume bars are plotted with 90% transparency, making them less visually dominant but still informative.
Usage
• Overlay: The indicator is set to overlay=true, meaning it will be plotted directly on the price chart, allowing users to see the WMA and volume dynamics in the context of the price movements.
• WMA Length: The length of the WMA is set to 20 periods, which is a common setting for short to medium-term trend analysis.
• Visual Cues: The color changes in both the WMA and volume bars provide immediate visual cues about the trend and volume dynamics, helping traders make quicker decisions.
Detailed Explanation of the Script
1. Indicator Declaration:
o Declares the indicator with a descriptive name and specifies that it should be overlaid on the price chart.
2. WMA Calculation:
o Defines the length of the WMA and calculates it using the closing prices.
3. Plotting the WMA:
o Plots the WMA with full brightness (0 transparency).
4. Color-Coding the WMA:
o Changes the color of the WMA line based on the price's position relative to the WMA.
5. Volume Indicator:
o Plots the volume bars with color-coding based on the volume change from the previous period and with 90% transparency.
Conclusion
One of the most best combinations of Volume and Moving average and works on any given timeframe and charts
版本注释
Benefits1. Trend Identification:
o The script calculates a 20-period Weighted Moving Average (WMA) of the closing prices. This helps in smoothing out price data to identify the underlying trend.
o The color of the WMA line changes based on the price position relative to the WMA:
Green: When the current price is above the WMA, indicating a potential uptrend.
Red: When the current price is below the WMA, indicating a potential downtrend.
Blue: When the price is exactly at the WMA, indicating no clear trend.
2. Volume Dynamics:
o The script also plots the volume with a color-coding mechanism:
Green: When the current volume is higher than the previous period's volume, indicating increasing trading activity.
Red: When the current volume is lower than the previous period's volume, indicating decreasing trading activity.
o The volume bars are plotted with 90% transparency, making them less visually dominant but still informative.
Usage
• Overlay: The indicator is set to overlay=true, meaning it will be plotted directly on the price chart, allowing users to see the WMA and volume dynamics in the context of the price movements.
• WMA Length: The length of the WMA is set to 20 periods, which is a common setting for short to medium-term trend analysis.
• Visual Cues: The color changes in both the WMA and volume bars provide immediate visual cues about the trend and volume dynamics, helping traders make quicker decisions.
Detailed Explanation of the Script
1. Indicator Declaration:
o Declares the indicator with a descriptive name and specifies that it should be overlaid on the price chart.
2. WMA Calculation:
o Defines the length of the WMA and calculates it using the closing prices.
3. Plotting the WMA:
o Plots the WMA with full brightness (0 transparency).
4. Color-Coding the WMA:
o Changes the color of the WMA line based on the price's position relative to the WMA.
5. Volume Indicator:
o Plots the volume bars with color-coding based on the volume change from the previous period and with 90% transparency.
Conclusion
One of the most best combinations of Volume and Moving average and works on any given timeframe and charts
开源脚本
秉承TradingView的精神,该脚本的作者将其开源,以便交易者可以查看和验证其功能。向作者致敬!您可以免费使用该脚本,但请记住,重新发布代码须遵守我们的网站规则。
免责声明
这些信息和出版物并非旨在提供,也不构成TradingView提供或认可的任何形式的财务、投资、交易或其他类型的建议或推荐。请阅读使用条款了解更多信息。
开源脚本
秉承TradingView的精神,该脚本的作者将其开源,以便交易者可以查看和验证其功能。向作者致敬!您可以免费使用该脚本,但请记住,重新发布代码须遵守我们的网站规则。
免责声明
这些信息和出版物并非旨在提供,也不构成TradingView提供或认可的任何形式的财务、投资、交易或其他类型的建议或推荐。请阅读使用条款了解更多信息。