OPEN-SOURCE SCRIPT
已更新 Cash Flow Yields
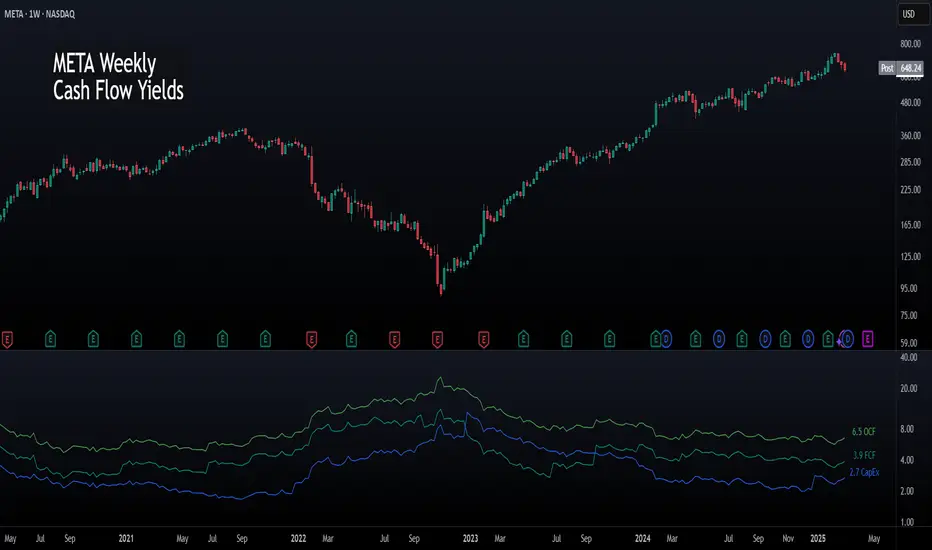
Cash Flow Yields Indicator
This indicator offers a straightforward way to visualize a company’s cash flow metrics—Free Cash Flow (FCF), Operating Cash Flow (OCF), and Capital Expenditures (CapEx)—as yields relative to its market capitalization. With the flexibility to switch between Trailing Twelve Months (TTM) and Quarterly data, it’s perfect for spotting financial efficiency trends at a glance. Values are plotted as dynamic lines with smart color coding and labeled for clarity.
Features:
To use it, add it to your chart and toggle between TTM or Quarterly to see trends. FCF should roughly equal OCF minus CapEx. Adjust your view to focus on companies with strong FCF yields for potential opportunities.
This indicator is freely available and open-source on TradingView for everyone to use. Enjoy!
This indicator offers a straightforward way to visualize a company’s cash flow metrics—Free Cash Flow (FCF), Operating Cash Flow (OCF), and Capital Expenditures (CapEx)—as yields relative to its market capitalization. With the flexibility to switch between Trailing Twelve Months (TTM) and Quarterly data, it’s perfect for spotting financial efficiency trends at a glance. Values are plotted as dynamic lines with smart color coding and labeled for clarity.
Features:
- TTM & Quarterly Data: Toggle between financial periods to suit your analysis.
- Color-Coded Lines: Green for positive OCF, teal for positive FCF, and blue for CapEx. Red and maroon kick in when values turn negative.
- Yield Perspective: See FCF, OCF, and CapEx as percentages of market cap, making it easy to compare cash flow strength across companies.
- Clear Labels: The latest values pop up on the chart, positioned to the right of the last bar.
- Simple & Intuitive: No clutter - just clean lines and numbers to help you focus on what matters.
To use it, add it to your chart and toggle between TTM or Quarterly to see trends. FCF should roughly equal OCF minus CapEx. Adjust your view to focus on companies with strong FCF yields for potential opportunities.
This indicator is freely available and open-source on TradingView for everyone to use. Enjoy!
版本注释
Minor formatting updates版本注释
Minor formatting update开源脚本
秉承TradingView的精神,该脚本的作者将其开源,以便交易者可以查看和验证其功能。向作者致敬!您可以免费使用该脚本,但请记住,重新发布代码须遵守我们的网站规则。
免责声明
这些信息和出版物并非旨在提供,也不构成TradingView提供或认可的任何形式的财务、投资、交易或其他类型的建议或推荐。请阅读使用条款了解更多信息。
开源脚本
秉承TradingView的精神,该脚本的作者将其开源,以便交易者可以查看和验证其功能。向作者致敬!您可以免费使用该脚本,但请记住,重新发布代码须遵守我们的网站规则。
免责声明
这些信息和出版物并非旨在提供,也不构成TradingView提供或认可的任何形式的财务、投资、交易或其他类型的建议或推荐。请阅读使用条款了解更多信息。