PROTECTED SOURCE SCRIPT
已更新 multi RSI channel for divergence / wave analysis
This is an indicator that will make analysis using RSI much easier!
This indicator is basically an RSI, that uses the concept of bollingerbands, and draws channel that corresponds with the real RSI value.
With this script, you will be able to
1.spot divergences visually, and much easier (rsi channel is set to 35/65-white 30/70-yellow 20/80-orange 15/85-red)
2.analyze the wave easier with the guidance of labels printed
For those people who use RSI alot, you will be able to use this indicator for spotting divergence scenarios before the divergence forms,
and with the multi-rsi channel & help of label, you will be able to visually know that the divergence has formed.
this indicator will help guide you to read RSI indicator much better, and I personally don't think that you need extra RSI indicator(default),
because this is much more intuitive, and you get all the benefits of RSI as well.
hope this helps someone like me who really wanted to use RSI channel more professionally!
版本注释
도형님 코드 수정본版本注释
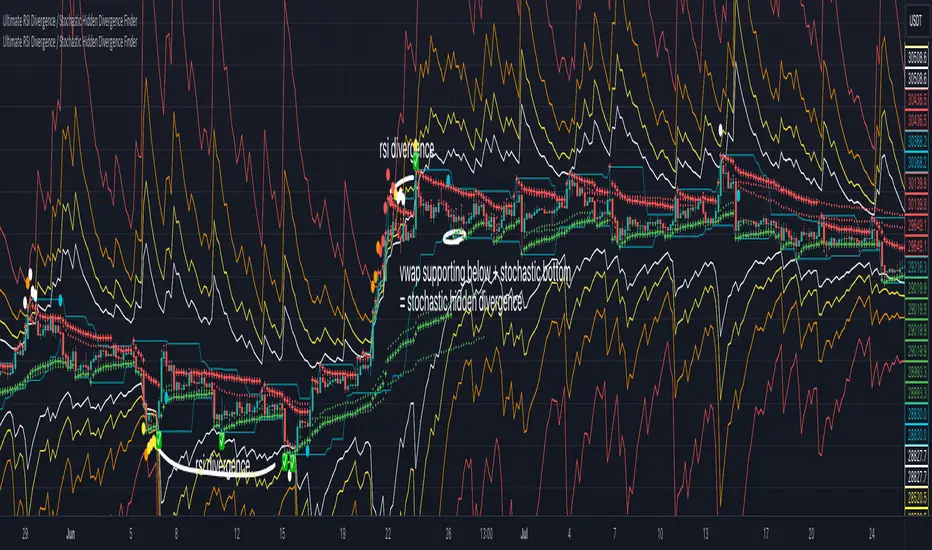
the best divergence indicator IMO.Regular divergence uses rsi 11 period, and each level is defined as
75, 80, 85, 90 (white,yellow,orange,red)
aqua circle is there to remind you that it has made enough pullback for divergence to be strong enough.
I recommend at least rsi of 85 or more for the highest RSI value (orange) and then create a regular divergence (green checkbox)
for hidden divergence, I think that stochastic indicator does the trick, and basically stochastic indicator is the same concept as donchian channel, so I'm using donchian channel as well as vwap in order to figure out if there exist a supporting vwap and the price touching the donchian channel. this means that there exist hidden divergence, and the quality is decided by the supporting vwap and overall structure of the price.
受保护脚本
此脚本以闭源形式发布。 但是,您可以自由使用,没有任何限制 — 了解更多信息这里。
免责声明
这些信息和出版物并非旨在提供,也不构成TradingView提供或认可的任何形式的财务、投资、交易或其他类型的建议或推荐。请阅读使用条款了解更多信息。
受保护脚本
此脚本以闭源形式发布。 但是,您可以自由使用,没有任何限制 — 了解更多信息这里。
免责声明
这些信息和出版物并非旨在提供,也不构成TradingView提供或认可的任何形式的财务、投资、交易或其他类型的建议或推荐。请阅读使用条款了解更多信息。