OPEN-SOURCE SCRIPT
已更新 Support and Resistance Levels [racer8]
One of the oldest concepts in trading. It's here guys. Drum roll please. Support & resistance baby! 🤣
So many requests from so many people asking me to build this. Finally. It is here guys 😀 Support and Resistance is here by racer8!
Indeed, S&R is used by so many traders. It is often one of the first concepts a trader will learn. I myself, can attest to this.
So what is support and resistance? 🤔
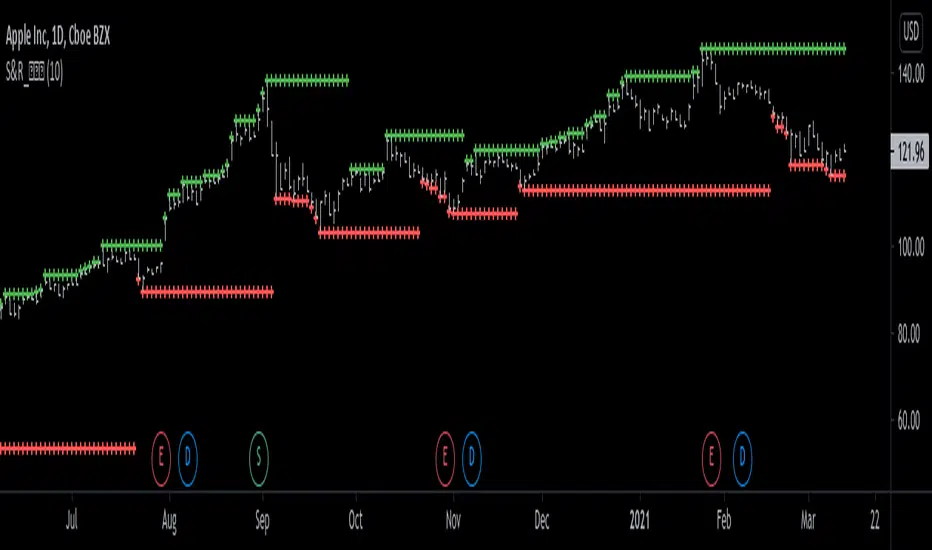
Good question, S&R are certain price levels that are created when a peak or trough has formed. Many traders use these peaks/troughs and extend lines out from them to create support & resistance levels.
Support levels are extended out from troughs. Resistance levels from peaks.
It is often believed that price bounces between these levels due to some unknown mysterious force known as supply and demand. 🙀
If you're a reversal trader, your strategy would likely be trying to short whenever price reaches a resistance level and vice versa for support levels.
If you're a trend trader, your strategy would likely be trying to go long whenever price breaks a resistance level and vice versa for support levels.
This Indicator...
Has one setting that controls which levels are formed. Higher settings equals less levels formed, but more important ones. Don't set it too high or too low. There is an optimal setting. Setting it too high will result in very few levels and thus, too little opportunities to trade. Setting it too low means the indicator will give you insignificant levels..also bad idea. So try to find something optimal like 10 to 20 periods for instance. 👍
Enjoy and have a blast!😀
Peace, I'm out! 🙏 💥
So many requests from so many people asking me to build this. Finally. It is here guys 😀 Support and Resistance is here by racer8!
Indeed, S&R is used by so many traders. It is often one of the first concepts a trader will learn. I myself, can attest to this.
So what is support and resistance? 🤔
Good question, S&R are certain price levels that are created when a peak or trough has formed. Many traders use these peaks/troughs and extend lines out from them to create support & resistance levels.
Support levels are extended out from troughs. Resistance levels from peaks.
It is often believed that price bounces between these levels due to some unknown mysterious force known as supply and demand. 🙀
If you're a reversal trader, your strategy would likely be trying to short whenever price reaches a resistance level and vice versa for support levels.
If you're a trend trader, your strategy would likely be trying to go long whenever price breaks a resistance level and vice versa for support levels.
This Indicator...
Has one setting that controls which levels are formed. Higher settings equals less levels formed, but more important ones. Don't set it too high or too low. There is an optimal setting. Setting it too high will result in very few levels and thus, too little opportunities to trade. Setting it too low means the indicator will give you insignificant levels..also bad idea. So try to find something optimal like 10 to 20 periods for instance. 👍
Enjoy and have a blast!😀
Peace, I'm out! 🙏 💥
版本注释
...To PineCoders & those reading:This S&R script adds value to the TV community and is unique because it has...
- simple easy to understand visuals (not cluttered with so many lines unlike some S&R scripts on TV)
- does not repaint (unlike some S&R scripts)
- allows users to see expansion & contraction phases much easier than most S&R scripts
- actually plots S&R levels (unlike some S&R scripts on TV)
- looks attractive :D
开源脚本
秉承TradingView的精神,该脚本的作者将其开源,以便交易者可以查看和验证其功能。向作者致敬!您可以免费使用该脚本,但请记住,重新发布代码须遵守我们的网站规则。
免责声明
这些信息和出版物并非旨在提供,也不构成TradingView提供或认可的任何形式的财务、投资、交易或其他类型的建议或推荐。请阅读使用条款了解更多信息。
免责声明
这些信息和出版物并非旨在提供,也不构成TradingView提供或认可的任何形式的财务、投资、交易或其他类型的建议或推荐。请阅读使用条款了解更多信息。