PROTECTED SOURCE SCRIPT
Strong Indicator for ISM Services PMI XAUUSD (mtbr)
Description:
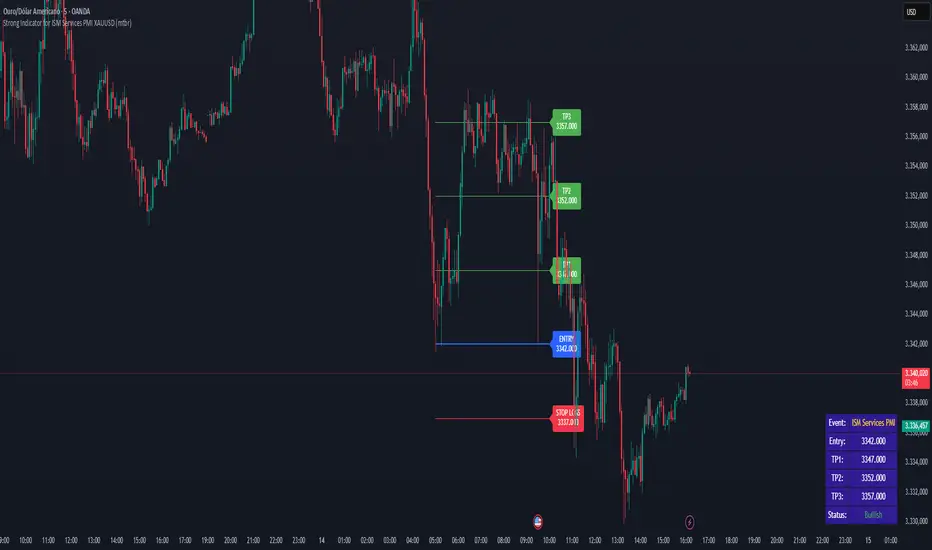
This indicator is designed to help traders visualize entry levels, targets (TP1, TP2, TP3), and stop loss around the ISM Services PMI economic event for the XAUUSD asset. It provides a clear reference for potential market movements based on the event’s surprise and market direction (Bullish or Bearish).
Key Features:
Customizable event date and time:
You can set the exact year, month, day, hour, and minute of the event so that the lines and labels appear precisely on the corresponding bar.
Surprise calculation and market direction:
The difference between Actual and Forecast is calculated and displayed in the table as Bullish, Bearish, or Neutral.
Price levels in pips:
Entry (Entry), three targets (TP1, TP2, TP3), and Stop Loss (SL) can be set in pips relative to the entry price.
Each level has independent lines and labels, which update only if the corresponding input value changes, keeping the rest of the chart intact.
Clear visualization on the chart:
Colored lines:
Entry → blue
TPs → green
Stop Loss → red
Vertical event line → orange, highlighting the release moment.
Integrated informative table:
Displays:
Event name
Entry price
TP1, TP2, TP3
Market direction status (Bullish/Bearish/Neutral)
Table colors reflect market direction (green for bullish, red for bearish, gray for neutral).
How to use the script:
Add the indicator to the XAUUSD chart.
Set the ISM Services PMI event date and time in the input panel.
Enter the Entry Price and pip values for TP1, TP2, TP3, and SL according to your strategy.
The indicator will automatically draw lines and labels on the chart and update the table with the event details and market direction.
Whenever you change an input value, only the corresponding line and label will update, keeping other levels fixed.
Important Notes:
The indicator does not perform automatic trades; it serves as a visual reference for trading decisions.
Ensure the event timezone is set correctly to match the release time in your local time zone.
Use in combination with your own risk management and trading strategy.
TradingView publication rules followed:
Full instructions for using the indicator
Clear explanation of inputs and settings
Description of lines and label behavior
Disclaimer that the script is educational and visual, not automated trading
受保护脚本
此脚本以闭源形式发布。 但是,您可以自由使用,没有任何限制 — 了解更多信息这里。
免责声明
这些信息和出版物并非旨在提供,也不构成TradingView提供或认可的任何形式的财务、投资、交易或其他类型的建议或推荐。请阅读使用条款了解更多信息。
受保护脚本
此脚本以闭源形式发布。 但是,您可以自由使用,没有任何限制 — 了解更多信息这里。
免责声明
这些信息和出版物并非旨在提供,也不构成TradingView提供或认可的任何形式的财务、投资、交易或其他类型的建议或推荐。请阅读使用条款了解更多信息。