OPEN-SOURCE SCRIPT
VDVA - Volume Delta Volatility Amplifier
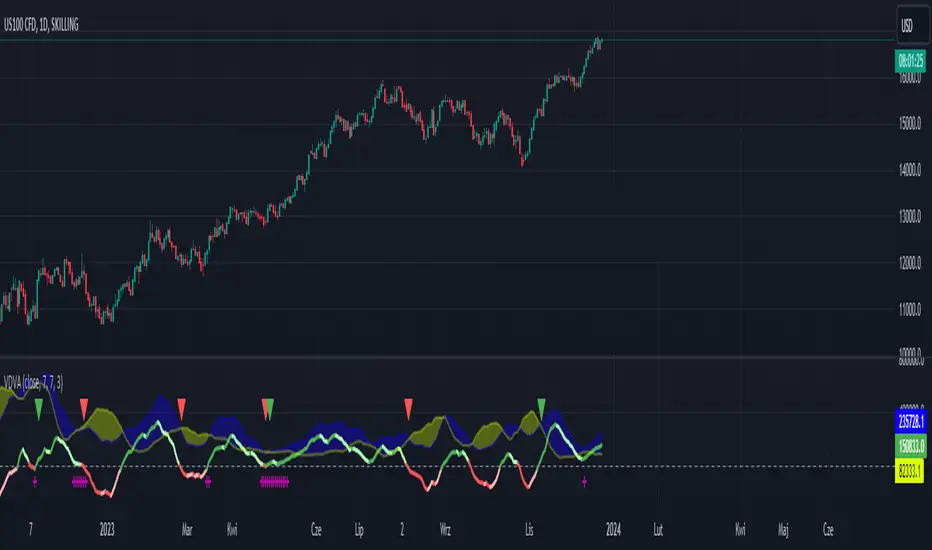
This script defines an indicator named VDVA (Volume Delta Volatility Amplifier), which combines volume delta (the difference between volume up and volume down) and volatility (ATR) into one line. This line is then smoothed using a moving average and compared with the zero level and a shorter-period moving average. The script also plots shapes when the rate of change of the line exceeds the first standard deviation. Moreover, the script uses Bollinger Bands and Keltner Channels to determine the squeeze condition, which is a signal of a potential breakout. Finally, the script plots two bar charts that show the volume up and volume down multiplied by ATR.
dark green line - bullish
light green line - potential bearish
dark red line - bearish
light red line - potential bullish
blue cloud - bullish
yellow cloud - bearish
red triangle - bearish entry
green triangle - bullish entry
purple cross - squeeze
dark green line - bullish
light green line - potential bearish
dark red line - bearish
light red line - potential bullish
blue cloud - bullish
yellow cloud - bearish
red triangle - bearish entry
green triangle - bullish entry
purple cross - squeeze
开源脚本
秉承TradingView的精神,该脚本的作者将其开源,以便交易者可以查看和验证其功能。向作者致敬!您可以免费使用该脚本,但请记住,重新发布代码须遵守我们的网站规则。
免责声明
这些信息和出版物并非旨在提供,也不构成TradingView提供或认可的任何形式的财务、投资、交易或其他类型的建议或推荐。请阅读使用条款了解更多信息。
免责声明
这些信息和出版物并非旨在提供,也不构成TradingView提供或认可的任何形式的财务、投资、交易或其他类型的建议或推荐。请阅读使用条款了解更多信息。