OPEN-SOURCE SCRIPT
Kitti-Playbook ATR Study R0
Date : Aug 22 2025
Kitti-Playbook ATR Study R0
This is used to study the operation of the ATR Trailing Stop on the Long side, starting from the calculation of True Range.
1) Studying True Range Calculation
1.1) Specify the Bar graph you want to analyze for True Range. Enable "Show Selected Price Bar" to locate the desired bar.
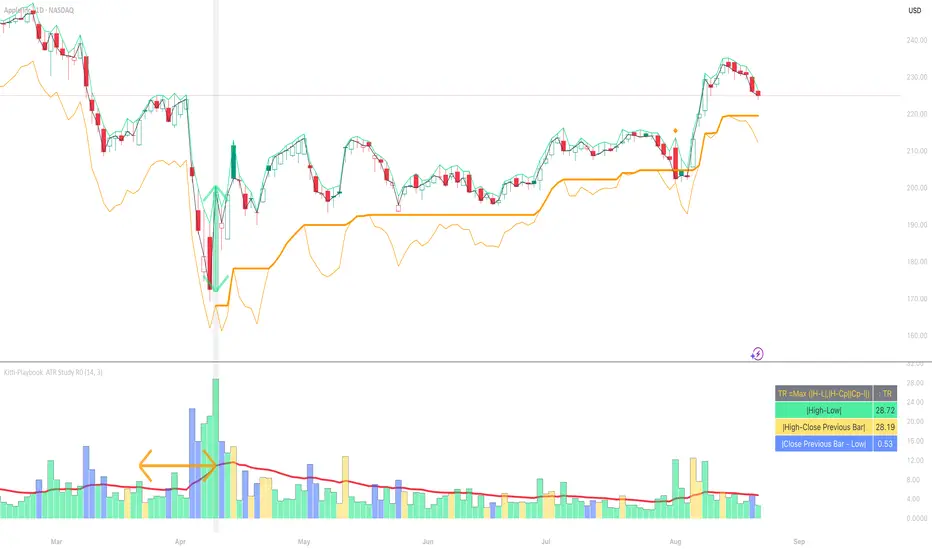
1.2) Enable/disable "Display True Range" in the Settings. True Range is calculated as: TR = Max (|H - L|, |H - Cp|, |Cp - L|)
• Show True Range: Each color on the bar represents the maximum range value selected:
◦ |H - L| = Green
◦ |H - Cp| = Yellow
◦ |Cp - L| = Blue
• Show True Range on Selected Price Bar: An arrow points to the range, and its color represents the maximum value chosen:
◦ |H - L| = Green
◦ |H - Cp| = Yellow
◦ |Cp - L| = Blue
• Show True Range Information Table: Displays the actual values of |H - L|, |H - Cp|, and |Cp - L| from the selected bar.
2) Studying Average True Range (ATR)
2.1) Set the ATR Length in Settings. Default value: ATR Length = 14
2.2) Enable/disable "Display Average True Range (RMA)" in Settings:
• Show ATR
• Show ATR Length from Selected Price Bar (An arrow will point backward equal to the ATR Length)
3) Studying ATR Trailing
3.1) Set the ATR Multiplier in Settings. Default value: ATR Multiply = 3
3.2) Enable/disable "Display ATR Trailing" in Settings:
• Show High Line
• Show ATR Bands
• Show ATR Trailing
4) Studying ATR Trailing Exit
(Occurs when the Close price crosses below the ATR Trailing line)
Enable/disable "Display ATR Trailing" in Settings:
• Show Close Line
• Show Exit Points (Exit points are marked by an orange diamond symbol above the price bar)
开源脚本
秉承TradingView的精神,该脚本的作者将其开源,以便交易者可以查看和验证其功能。向作者致敬!您可以免费使用该脚本,但请记住,重新发布代码须遵守我们的网站规则。
免责声明
这些信息和出版物并非旨在提供,也不构成TradingView提供或认可的任何形式的财务、投资、交易或其他类型的建议或推荐。请阅读使用条款了解更多信息。
开源脚本
秉承TradingView的精神,该脚本的作者将其开源,以便交易者可以查看和验证其功能。向作者致敬!您可以免费使用该脚本,但请记住,重新发布代码须遵守我们的网站规则。
免责声明
这些信息和出版物并非旨在提供,也不构成TradingView提供或认可的任何形式的财务、投资、交易或其他类型的建议或推荐。请阅读使用条款了解更多信息。