OPEN-SOURCE SCRIPT
Taiyoz Gaps
1. Purpose
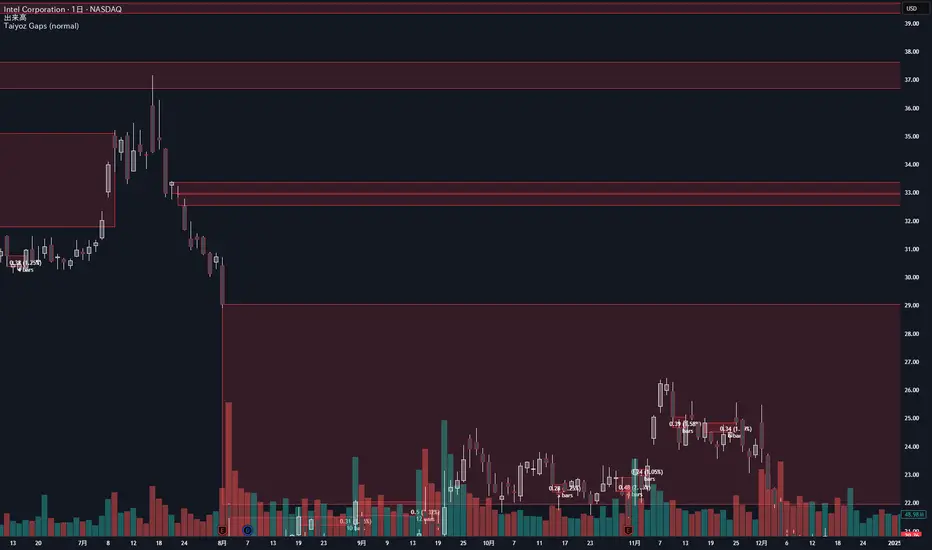
Tyoz Gaps highlights “gaps” between yesterday’s close and today’s open directly on your chart. A gap occurs when the opening price is significantly above or below the prior bar’s close. By drawing persistent boxes around each gap, you can instantly see where price left a void and monitor when (or if) that void gets completely filled.
2. Gap Detection Logic
Threshold: A gap is only detected if the open-to-previous-close difference exceeds a user-defined “Minimal Deviation” (percentage of the 14-bar average high-low range).
Direction:
Gap Up: today’s open > yesterday’s close
Gap Down: today’s open < yesterday’s close
3. Box Drawing
For each detected gap, the script draws a rectangular box spanning from yesterday’s close level to today’s open level.
Border & Fill Colors are configurable separately for up-gaps and down-gaps.
Boxes extend to the right as new bars form.
4. Display & Filtering Options
Show Gap Up / Show Gap Down toggles let you hide bullish or bearish gaps independently.
Max Number of Gaps: Limits how many boxes remain on-screen; oldest boxes are removed when the limit is exceeded.
Limit Max Gap Trail Length: Optionally force-close any gap box after a given number of bars, even if unfilled.
5. Closing Logic
Full-Fill Only: A gap box stays visible until price fully “fills” it—i.e., for an up-gap, price must exceed the top edge (yesterday’s close); for a down-gap, price must cross below the bottom edge.
Once filled, the box is removed and a “Gap Closed” alert flag is set.
6. Labels & Alerts
Each active gap can optionally show a label at the gap’s lower edge containing:
Absolute size (in price points) and percentage of the gap
Bar count since the gap formed
Label Text Color and Label Text Size are both user-configurable.
Two built-in alertcondition()s fire when a new gap appears or when a gap closes.
开源脚本
秉承TradingView的精神,该脚本的作者将其开源,以便交易者可以查看和验证其功能。向作者致敬!您可以免费使用该脚本,但请记住,重新发布代码须遵守我们的网站规则。
免责声明
这些信息和出版物并非旨在提供,也不构成TradingView提供或认可的任何形式的财务、投资、交易或其他类型的建议或推荐。请阅读使用条款了解更多信息。
免责声明
这些信息和出版物并非旨在提供,也不构成TradingView提供或认可的任何形式的财务、投资、交易或其他类型的建议或推荐。请阅读使用条款了解更多信息。