PROTECTED SOURCE SCRIPT
[INVX] Relative Volatility Measure (RVM)
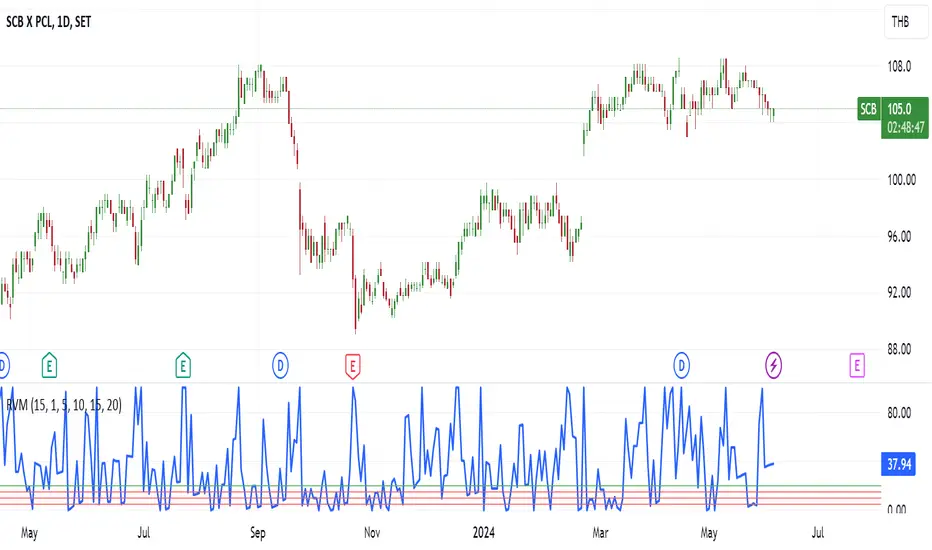
Many top performing traders often discuss the importance of identifying tightness in price action as part of their entry tactics. BUT! it is difficult to find and detect, RVM is created to solve this issues.
RVM – help trader to easily visualize and identify tight area , Save hours looking through chart to find price contractions.
What is it ?
It is an oscillator design to help trader identify tight price action area quickly
RVM make it easy to read a chart like a pro save hours to look through chart finding contraction area
How does it work ?
How to use it ?
Why is it useful ?
Tight price action, paired with decreased volume, is a sign that buying and selling have reached an equilibrium. During this equilibrium, the stock becomes coiled, ready to expand quickly to the upside or downside.
Areas with tightness of price are evidence of institutional accumulation,
and create potential buy points to jump on a trend.

RVM – help trader to easily visualize and identify tight area , Save hours looking through chart to find price contractions.
What is it ?
It is an oscillator design to help trader identify tight price action area quickly
RVM make it easy to read a chart like a pro save hours to look through chart finding contraction area
How does it work ?
- Compare current price action to previous price movement
- The oscillator tell whether if the stock is expand or tightens
How to use it ?
- RVM < 15 : If the RVM shows less than 15, it means that the price tightens; the closer to 0, the tighter it gets.
- RVM > 80 : The price expand, the value increase to the maximum of 100
Why is it useful ?
Tight price action, paired with decreased volume, is a sign that buying and selling have reached an equilibrium. During this equilibrium, the stock becomes coiled, ready to expand quickly to the upside or downside.
Areas with tightness of price are evidence of institutional accumulation,
and create potential buy points to jump on a trend.
受保护脚本
此脚本以闭源形式发布。 但是,您可以自由使用,没有任何限制 — 了解更多信息这里。
免责声明
这些信息和出版物并非旨在提供,也不构成TradingView提供或认可的任何形式的财务、投资、交易或其他类型的建议或推荐。请阅读使用条款了解更多信息。
免责声明
这些信息和出版物并非旨在提供,也不构成TradingView提供或认可的任何形式的财务、投资、交易或其他类型的建议或推荐。请阅读使用条款了解更多信息。