OPEN-SOURCE SCRIPT
HTF Support & Resistance [QuantVue]
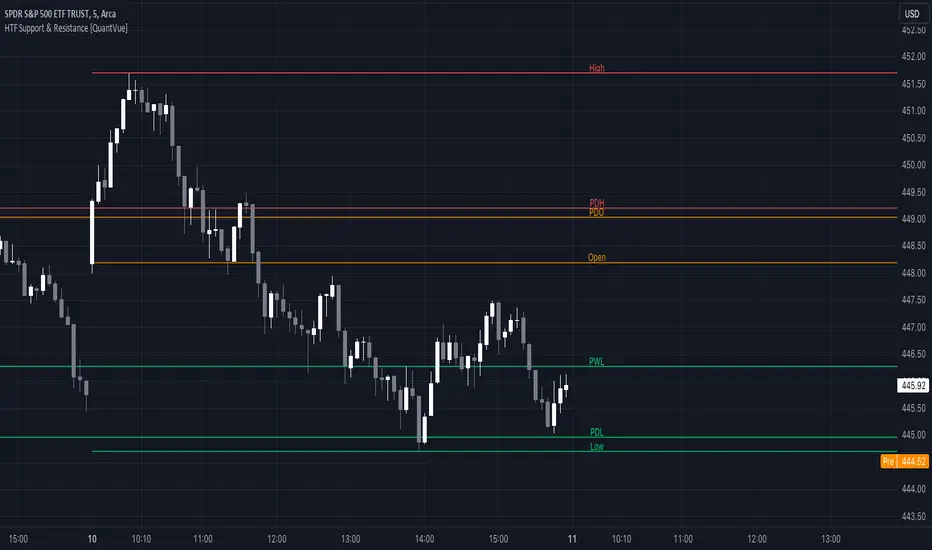
The "HTF Support / Resistance" indicator highlights critical price levels across multiple timeframes helping you recognize major support/resistance areas.
Whether you're a day trader needing to understand the current day's price action, or a long-term investor looking to analyze yearly trends, this indicator can be a valuable addition to your trading toolkit.
The daily levels, which can be enabled or disabled according to your preference, will give you insights into the open, high, and low levels for the current and previous day.
Similarly, weekly levels provide information for the current and previous weeks, while monthly levels cover the current and previous months.
In addition, the indicator offers more extended views through its quarterly and yearly levels. These will help you understand long-term trends and major support/resistance areas, and they can be particularly beneficial for major support/resistance levels.
Features:
🔹Visualization: View support and resistance levels from Daily, Weekly, Monthly, Quarterly, and Yearly timeframes.
🔹Customizable Appearance: Tailor the display colors and line styles for each level according to your preferences.
🔹Clear Labeling: Each level is clearly labeled for quick identification.
🔹Extension Option: Opt to extend the support and resistance lines across the chart for better visualization.
Give this indicator a BOOST and COMMENT your thoughts!
We hope you enjoy.
Cheers.
开源脚本
秉承TradingView的精神,该脚本的作者将其开源,以便交易者可以查看和验证其功能。向作者致敬!您可以免费使用该脚本,但请记住,重新发布代码须遵守我们的网站规则。
Get Access to the exclusive QuantVue indicators: quantvue.io/
Join thousands of traders in our Free Discord: discord.gg/tC7u7magU3
Join thousands of traders in our Free Discord: discord.gg/tC7u7magU3
免责声明
这些信息和出版物并非旨在提供,也不构成TradingView提供或认可的任何形式的财务、投资、交易或其他类型的建议或推荐。请阅读使用条款了解更多信息。