OPEN-SOURCE SCRIPT
Linear Regression Slope
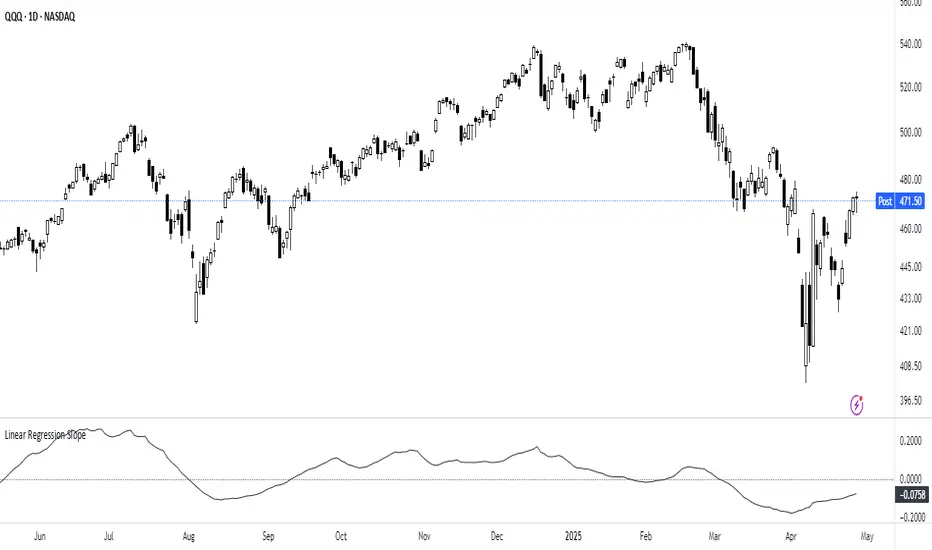
The Linear Regression Slope provides a quantitative measure of trend direction. It fits a linear regression line to the past N closing prices and calculates the slope, representing the average rate of price change per bar.
To ensure comparability across assets and timeframes, the slope is normalized by the ATR over a shorter window. This produces a volatility-adjusted measure which allows for the slope to be interpreted relative to typical price fluctuations.
Mathematically, the slope is derived by minimizing the sum of squared deviations between actual prices and the fitted regression line. A positive normalized slope indicate upwards movement; a negative slope indicate downwards movement. Persistent values near zero could indicate an absence of clear trend, with price dominated by short-term fluctuations or noise.
The definition of a trend depends on the period of observation. The lookback setting should be set based on to the desired timeframe. Shorter lookbacks will respond faster to recent changes but may be more sensitive to noise, while longer lookbacks will emphasize broader structures.
While effective at quantifying existing trends, this method is not predictive. Sudden regime changes, volatility shocks, and non-linear dynamics can all cause rapid slope reversals. Therefore, it is best applied as part of a broader analytical framework.
In summary, the Linear Regression Slope quantifies price direction and serves as a measurable supplement to the visual assessment of trends on price charts.
Additional Features:
- Option to display or hide the normalized slope line.
- Option to enable background coloring when the slope is above or below zero.
开源脚本
秉承TradingView的精神,该脚本的作者将其开源,以便交易者可以查看和验证其功能。向作者致敬!您可以免费使用该脚本,但请记住,重新发布代码须遵守我们的网站规则。
Technical Trading: Research and Application
stockleave.com/
stockleave.com/
免责声明
这些信息和出版物并非旨在提供,也不构成TradingView提供或认可的任何形式的财务、投资、交易或其他类型的建议或推荐。请阅读使用条款了解更多信息。
开源脚本
秉承TradingView的精神,该脚本的作者将其开源,以便交易者可以查看和验证其功能。向作者致敬!您可以免费使用该脚本,但请记住,重新发布代码须遵守我们的网站规则。
Technical Trading: Research and Application
stockleave.com/
stockleave.com/
免责声明
这些信息和出版物并非旨在提供,也不构成TradingView提供或认可的任何形式的财务、投资、交易或其他类型的建议或推荐。请阅读使用条款了解更多信息。