OPEN-SOURCE SCRIPT
已更新 Price - Mean Reversion Expansion
A simple indicator, to plot the quantitatively the reversion and expansion of price from a set of means.
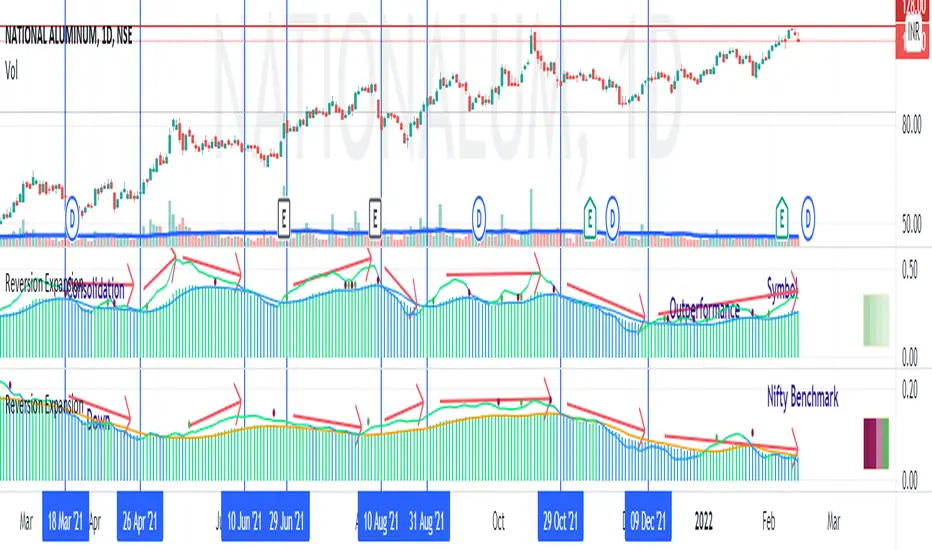
A green bar plots prices above the set of means. A bar plots prices below the set of means. A blue bar plots price entangled in the means. The height of the bars denotes the far-ness from the set of means.
A blue envelope over the bars is the average of this reversion/expansion. A "crossover" of any bar (red/green) over this envelope is indicated by a "green dot" a "crossunder" of any bar (red/green) under this envelope is indicated by a "red dot".
The small trend strength table (when enabled) on the right side below show in a easy manner the data presented in the "Mean Angles" indicator. Refer to description there for more details.
版本注释
- Added Price Delta, scaled price performance
Added an overlap of scaled price movement vis-a-vis the expansion and contraction. Clearly identifies the trend changes and objectively defines expansion and reversion.
版本注释
- Option to select another symbol (benchmark) instead of the chart symbol
This option will help in measuring the reversion / expansion vis-a-vis broader benchmark when placed side-by-side. When the other symbol (benchmark is ticked, the envelope will be of orange color and not the usual blue color. This will help in quick identification.
Refer to
The lower plot is orange envelope, that of the benchmark. We can clearly observe regions where the symbol followed the benchmark, outperforms or lags the benchmark. This analysis can be done over multiple timeframes.
版本注释
- Fixed other symbol EMA calculations when valid mean length of symbol starts later than benchmark
版本注释
- Update Pine Script version 6
- Alert conditions and TrendLength additions - for Pine Screener
开源脚本
秉承TradingView的精神,该脚本的作者将其开源,以便交易者可以查看和验证其功能。向作者致敬!您可以免费使用该脚本,但请记住,重新发布代码须遵守我们的网站规则。
免责声明
这些信息和出版物并非旨在提供,也不构成TradingView提供或认可的任何形式的财务、投资、交易或其他类型的建议或推荐。请阅读使用条款了解更多信息。
开源脚本
秉承TradingView的精神,该脚本的作者将其开源,以便交易者可以查看和验证其功能。向作者致敬!您可以免费使用该脚本,但请记住,重新发布代码须遵守我们的网站规则。
免责声明
这些信息和出版物并非旨在提供,也不构成TradingView提供或认可的任何形式的财务、投资、交易或其他类型的建议或推荐。请阅读使用条款了解更多信息。