OPEN-SOURCE SCRIPT
Dynamic Price Zone
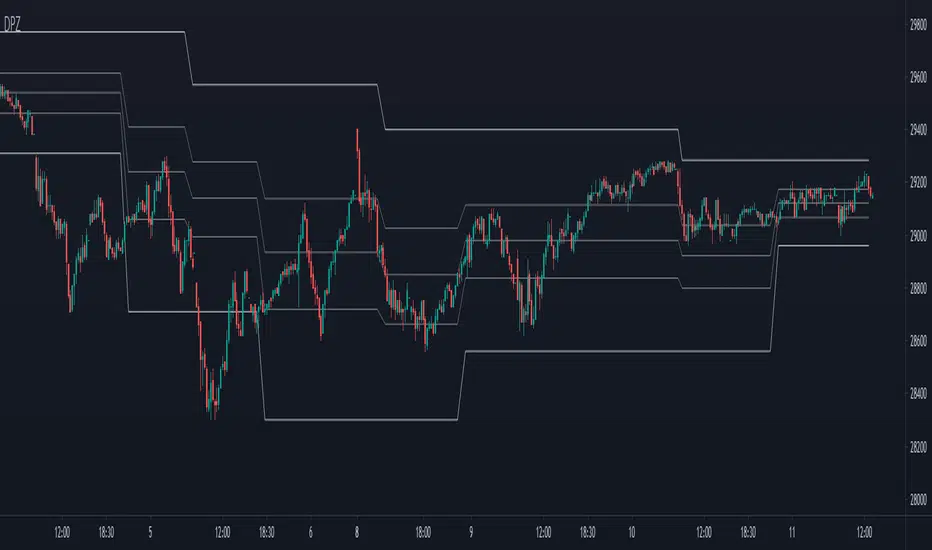
This indicator dynamically divides the price range into six zones.
1. Over Resistance (Strong up trend)
2. UpperMiddle to Resistance
3. Middle to UpperMiddle
4. Middle to LowerMiidle
5. LowerMiddle to Support
6. Under Support (Strong down Trend)
Resistance and Support are calculated by HMA.
Usage:
It is recommended to use this indicator on the higher time frames.
The image is 15 minutes chart and resolution 1hour for indicator.
- Pay attention to whether the range from resistance to support is shrinking or expanding!
- A major trend begins with a break in resistance and support.
- The five lines also work as a support or resistance.
- When the zone changes, the price is likely to reach the next line.
- UpperMiddle and LowerMiddle settings can be selected from 3 types.
- 75%, 66%, 61.8%(fibonacci) for UpperMiddle.
开源脚本
秉承TradingView的精神,该脚本的作者将其开源,以便交易者可以查看和验证其功能。向作者致敬!您可以免费使用该脚本,但请记住,重新发布代码须遵守我们的网站规则。
免责声明
这些信息和出版物并非旨在提供,也不构成TradingView提供或认可的任何形式的财务、投资、交易或其他类型的建议或推荐。请阅读使用条款了解更多信息。
免责声明
这些信息和出版物并非旨在提供,也不构成TradingView提供或认可的任何形式的财务、投资、交易或其他类型的建议或推荐。请阅读使用条款了解更多信息。