OPEN-SOURCE SCRIPT
已更新 User Selectable Moving Average Guppy

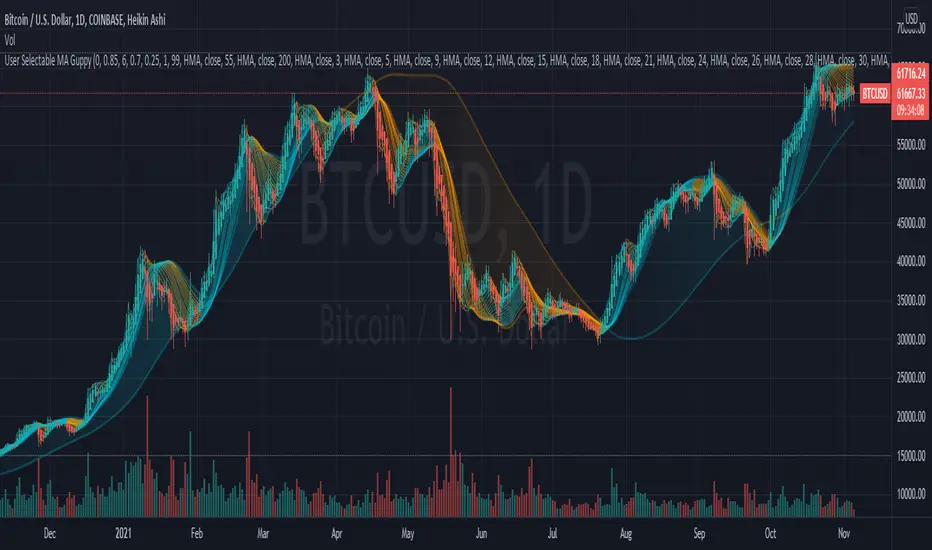
A version of the popular "Moving Average Ribbon" or "Guppy" indicators, except nearly everything about it is user selectable. The user can change the source, period, and type of moving average used for every single line on the chart. Note: The visuals are fairly intensive and may take a moment to catch up after adjusting settings.
Credit: This script utilizes the "Color Gradient Framework" tutorial by LucF (PineCoders) to create gradient visuals, which are also customizable for the user.
Moving Average Options:
Value Added:
Credit: This script utilizes the "Color Gradient Framework" tutorial by LucF (PineCoders) to create gradient visuals, which are also customizable for the user.
Moving Average Options:
- Running (SMoothed) Moving Average (RMA or SMMA) - Slowest
- Simple Moving Average (SMA) - Slow
- Exponential Moving Average (EMA) - Responds faster to price than SMA
- Weighted Moving Average (WMA)
- Volume-Weighted Moving Average (VWMA)
- Triple EMA (TEMA)
- Exponential Hull Moving Average (EHMA) - Hull with Smoothing (Slower than Hull)
- Least Squares Moving Average (LSMA) - Simple Linear Regression
- Arnaud Legoux Moving Average (ALMA) - Adjustable, set offset=1 to be current, offset=0.85 for good smoothing (Slower)
- Hull Moving Average (HMA) - Normally responds fastest to price of all options
Value Added:
- This script is unique in that it allows the user to chart the "Guppy", except nearly everything about it is customizable. The user can change the source, period, and type of moving average used for every single line.
- Typically, the Guppy is plotted with simple moving average or exponential moving average, which respond much slower to price than the Hull Moving Average, which this indicator uses as default. (Elimination of lag)
- The Hull MA settings for the highest time frame moving averages should work well for assessing the overall macro trend, with a nice visual presentation. Additional labels and alerts for the macro trend are available.
- Furthermore, this script provides many more options for type of moving average than is typical for a moving average indicator that provides the user with options, including advanced options such as Hull, TEMA, and ALMA.
- The visual presentation is customizable and should provide some entertainment for users who want to create pretty charts.
版本注释
9-OCT-21 : Converted from Pine v4 to v5.版本注释
12-OCT-21: Added Tillson T3 upon request.版本注释
13-OCT-21: Fixed up Tillson T3 formula somewhat (was using a fixed source instead of selectable previously)版本注释
3-nov-21: added timeframe/gaps, consolidated menu, made color scheme consistent版本注释
5-nov-21: added rainbow colors版本注释
5-nov-21: reverted color scheme, rainbow will be used in future indicators, this one was fine as is开源脚本
秉承TradingView的精神,该脚本的作者将其开源,以便交易者可以查看和验证其功能。向作者致敬!您可以免费使用该脚本,但请记住,重新发布代码须遵守我们的网站规则。
免责声明
这些信息和出版物并非旨在提供,也不构成TradingView提供或认可的任何形式的财务、投资、交易或其他类型的建议或推荐。请阅读使用条款了解更多信息。
开源脚本
秉承TradingView的精神,该脚本的作者将其开源,以便交易者可以查看和验证其功能。向作者致敬!您可以免费使用该脚本,但请记住,重新发布代码须遵守我们的网站规则。
免责声明
这些信息和出版物并非旨在提供,也不构成TradingView提供或认可的任何形式的财务、投资、交易或其他类型的建议或推荐。请阅读使用条款了解更多信息。