OPEN-SOURCE SCRIPT
已更新 Sector Relative Strength
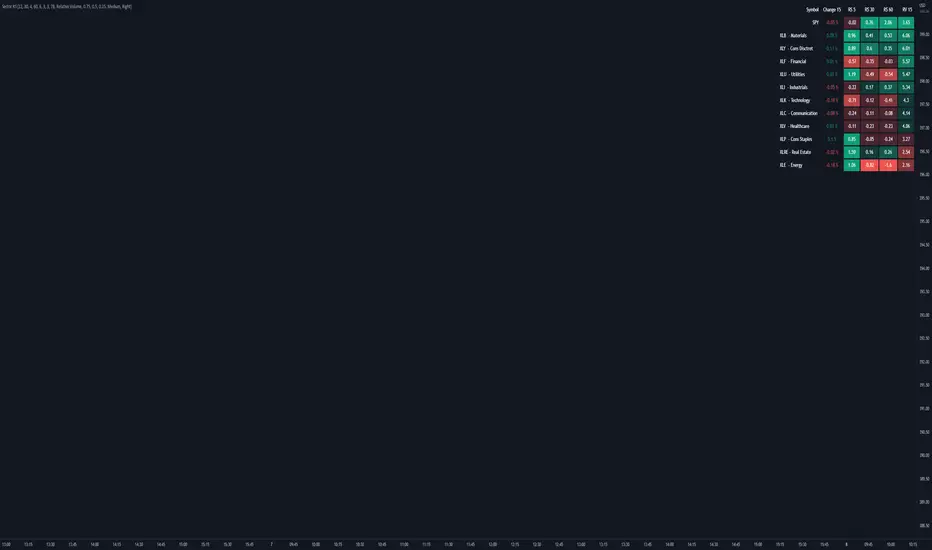
Custom version of my previous scanner built for S&P sectors
版本注释
The update introduce a completly revamped script, focused on the S&P sectors. This new version is less customizable but easier to use and more reliable : you can now load it on any timeframe and you're less likely to encounter an error message.However if you want to go back to the previous version, you can get the old code here : https://pastebin.com/2wRqTpP3
The script can still display up to 5 columns of your choice and rank the sector using any ot these columns :
- 1 Price change
- 1 Relative volume
- 3 different Relative Strength
Note:
- The first relative strength column, price change and relative volume are always using the 5 minute data and you can't change that. However you are free to change the period of the Relative strength and the number of candles used to calculate the price change and the relative volume.
- The second and third relative strength are completly customizable
- The formula used for the relative strength use the ATR but doesn't include volume
- The relative strength value for SPY correspond to the change divided by the ATR, this value is then used to calculate the Rs of each sector (sector_change - ((spy_change / spy_atr) * sector_atr)) / sector_atr
- Concerning the colors of the relative volume, SPY RV turns green when above 1, but the sector RV are turning green when above the SPY RV
版本注释
Added a minor change开源脚本
秉承TradingView的精神,该脚本的作者将其开源,以便交易者可以查看和验证其功能。向作者致敬!您可以免费使用该脚本,但请记住,重新发布代码须遵守我们的网站规则。
免责声明
这些信息和出版物并非旨在提供,也不构成TradingView提供或认可的任何形式的财务、投资、交易或其他类型的建议或推荐。请阅读使用条款了解更多信息。
开源脚本
秉承TradingView的精神,该脚本的作者将其开源,以便交易者可以查看和验证其功能。向作者致敬!您可以免费使用该脚本,但请记住,重新发布代码须遵守我们的网站规则。
免责声明
这些信息和出版物并非旨在提供,也不构成TradingView提供或认可的任何形式的财务、投资、交易或其他类型的建议或推荐。请阅读使用条款了解更多信息。