OPEN-SOURCE SCRIPT
已更新 RoC Momentum Cycle
RoC Momentum Cycles (RMC) is derived from RoC (Rate of Change) indicator.
Motivation behind RMC: Addressing RoC’s Shortcomings
While the Rate of Change (RoC) indicator is a valuable tool for assessing momentum, it has notable limitations that traders must be aware of. One of the primary challenges with the traditional RoC is its sensitivity to price fluctuations, which can lead to false signals in volatile markets. This often results in premature entries or exits, impacting trading performance.
By smoothing out the RoC calculations and focusing on more consistent signal generation (using SMA on smoothed RoC), RMC offers a more consistent representation of price trends.
Momentum Cycles
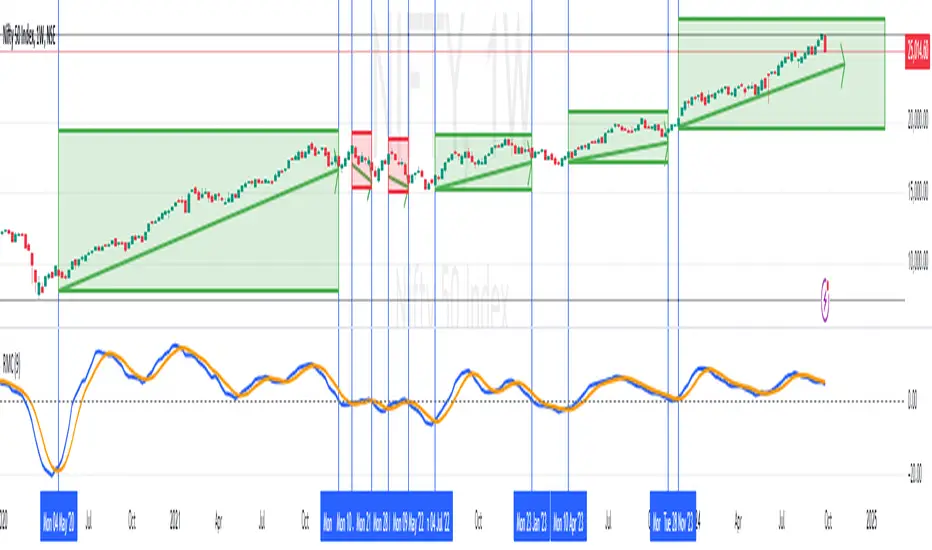
RMC helps visualize momentum cycles in a much better way compared to RoC.
Motivation behind RMC: Addressing RoC’s Shortcomings
While the Rate of Change (RoC) indicator is a valuable tool for assessing momentum, it has notable limitations that traders must be aware of. One of the primary challenges with the traditional RoC is its sensitivity to price fluctuations, which can lead to false signals in volatile markets. This often results in premature entries or exits, impacting trading performance.
By smoothing out the RoC calculations and focusing on more consistent signal generation (using SMA on smoothed RoC), RMC offers a more consistent representation of price trends.
Momentum Cycles
RMC helps visualize momentum cycles in a much better way compared to RoC.
- Long Momentum Cycle: A cross-over of smoothed RoC (blue line) above averaged signal (orange line) below zero marks start of a new potential upside cycle which ends when the blue line comes back to zero line from above.
- Short Momentum Cycle: A cross-under of blue line below orange line above zero marks beginning of a potential downside cycle which ends when the blue line comes back to zero from below.
版本注释
Updated with annotated chart and fixed a typo in script.版本注释
Added histogram to the indicator. Enabled by default but can be disabled from the style section under indicator settings.开源脚本
秉承TradingView的精神,该脚本的作者将其开源,以便交易者可以查看和验证其功能。向作者致敬!您可以免费使用该脚本,但请记住,重新发布代码须遵守我们的网站规则。
True Wave Scanner - scanner.elliottwavestrading.com
免责声明
这些信息和出版物并非旨在提供,也不构成TradingView提供或认可的任何形式的财务、投资、交易或其他类型的建议或推荐。请阅读使用条款了解更多信息。
开源脚本
秉承TradingView的精神,该脚本的作者将其开源,以便交易者可以查看和验证其功能。向作者致敬!您可以免费使用该脚本,但请记住,重新发布代码须遵守我们的网站规则。
True Wave Scanner - scanner.elliottwavestrading.com
免责声明
这些信息和出版物并非旨在提供,也不构成TradingView提供或认可的任何形式的财务、投资、交易或其他类型的建议或推荐。请阅读使用条款了解更多信息。