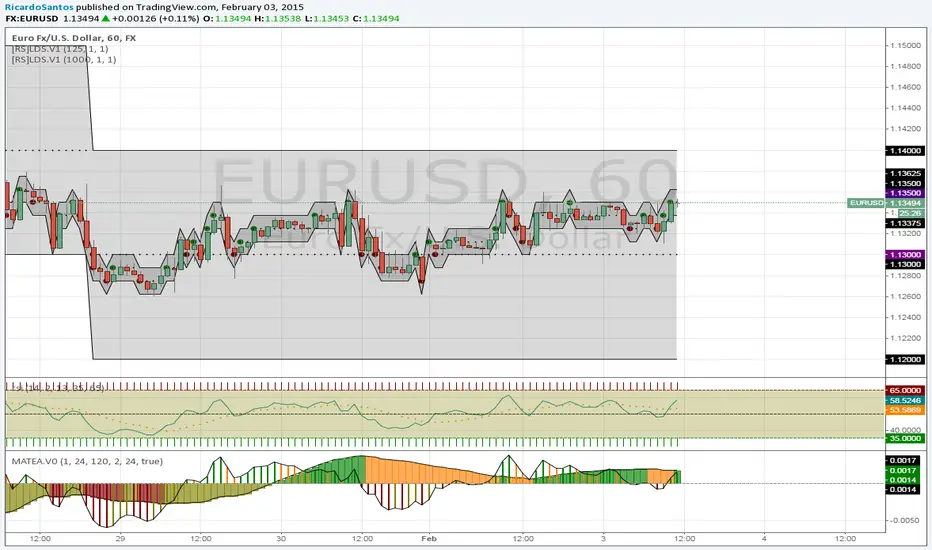
experimental: analyzing the differences between price closure and multiple moving averages to discern movement and direction of market.
upper signal is the long trend, while the lower signal symbolizes faster movements within the trend.
study(title="Moving Average Trend Expansion Analysis V0", shorttitle="MATEA.V0", overlay=false) length1 = input(1) length2 = input(24) length3 = input(120) source = close osc1 = sma(source, length1) - sma(source, length2) osc2 = sma(source, length1) - sma(source, length3) smooth1 = sma(osc1, input(2)) smooth2 = sma(osc2, input(24)) //plot(osc, color=gray, style=columns) scolor1=smooth1 > smooth1[1] and smooth1 > 0 ? green : smooth1 > smooth1[1] and smooth1 < 0 ? olive : smooth1 < smooth1[1] and smooth1 < 0 ? maroon : smooth1 < smooth1[1] and smooth1 > 0 ? orange : black scolor2=smooth2 > smooth2[1] and smooth2 > 0 ? green : smooth2 > smooth2[1] and smooth2 < 0 ? olive : smooth2 < smooth2[1] and smooth2 < 0 ? maroon : smooth2 < smooth2[1] and smooth2 > 0 ? orange : black plot(smooth2, color=scolor2, style=columns, linewidth=1) plot(smooth2, color=black, style=line, linewidth=1) plot(smooth1, color=scolor1, style=histogram, linewidth=2) plot(smooth1, color=black, style=line, linewidth=1) hline(0) // ||--- Caps analysis upperholder = nz(upper[1]) lowerholder = nz(lower[1]) upper = smooth2 >= upperholder ? smooth2 : upperholder lower = smooth2 <= lowerholder ? smooth2 : lowerholder signal1 = cross(smooth2, 0) ? upper : na signal2 = cross(smooth1, 0) ? lower : na signalcolor1 = smooth2 > 0 ? green : maroon signalcolor2 = smooth1 > 0 ? green : maroon hidesignals = input(true) plot(hidesignals ? na : signal1, style=cross, color=signalcolor1, linewidth=4) plot(hidesignals ? na : signal2, style=cross, color=signalcolor2, linewidth=4)