OPEN-SOURCE SCRIPT
Elite 30 Min Pivot - by TenAM Trader.
🔍 How It Works
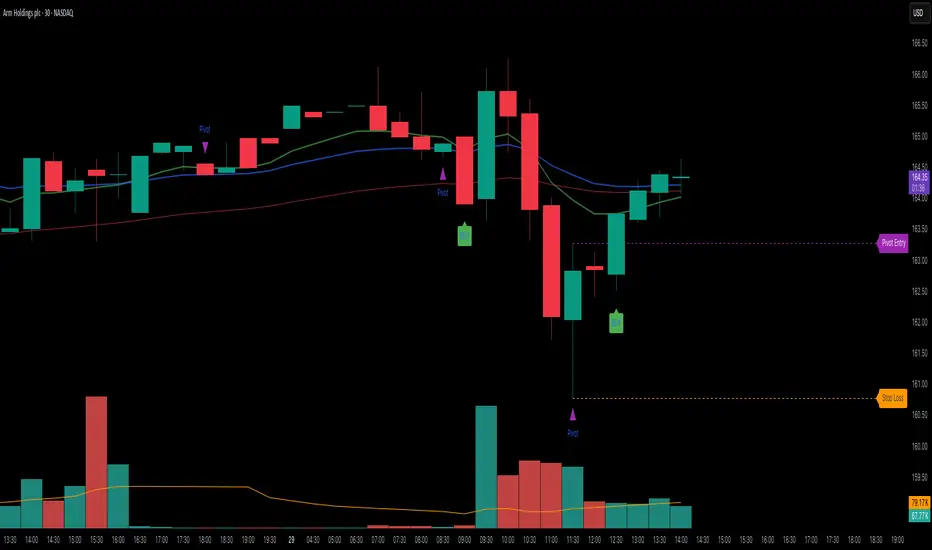
Trend Detection:
A trend is defined when a configurable number (default: 3) of same-colored candles (green or red) appear in a row.
The pivot is marked by the first opposite-color candle after the trend.
Signal Logic:
After the pivot forms, the script watches the next few candles (default: 2) for a breakout or close beyond the pivot high/low.
A BUY signal is triggered when price breaks/closes above a pivot high from a downtrend.
A SELL signal is triggered when price breaks/closes below a pivot low from an uptrend.
Entry & Risk Tools:
Optional features include:
Pivot Line – dashed level showing pivot entry point.
Stop Loss Line – opposite side of the pivot candle.
Labels – toggle labels for clarity on entry and risk.
Time Filter – exclude signals during specific hours (e.g. 11 AM–2 PM) to avoid lunchtime chop.
Alerts:
Enable alerts for automated notifications when buy or sell conditions are met.
⚙️ Customizable Settings
Consecutive candles required before pivot
Max bars allowed after pivot for signal
Signal trigger: Break or Close
Toggle visibility of pivot lines, stop loss, and labels
Set excluded time blocks
Enable/disable real-time alerts
✅ Use Case Example
If you set trend length to 3 and signal trigger to “Break,” the script will look for 3 consecutive red candles, then a green candle (pivot). If price breaks above the pivot high within the next 2 candles, a Buy signal will fire.
⚠️ Legal Note
This script is provided for educational and informational purposes only and does not constitute financial advice. Always do your own research before making trading decisions. Use at your own risk.
开源脚本
秉承TradingView的精神,该脚本的作者将其开源,以便交易者可以查看和验证其功能。向作者致敬!您可以免费使用该脚本,但请记住,重新发布代码须遵守我们的网站规则。
免责声明
这些信息和出版物并非旨在提供,也不构成TradingView提供或认可的任何形式的财务、投资、交易或其他类型的建议或推荐。请阅读使用条款了解更多信息。
开源脚本
秉承TradingView的精神,该脚本的作者将其开源,以便交易者可以查看和验证其功能。向作者致敬!您可以免费使用该脚本,但请记住,重新发布代码须遵守我们的网站规则。
免责声明
这些信息和出版物并非旨在提供,也不构成TradingView提供或认可的任何形式的财务、投资、交易或其他类型的建议或推荐。请阅读使用条款了解更多信息。