PROTECTED SOURCE SCRIPT
已更新 NimhFX Grid Levels
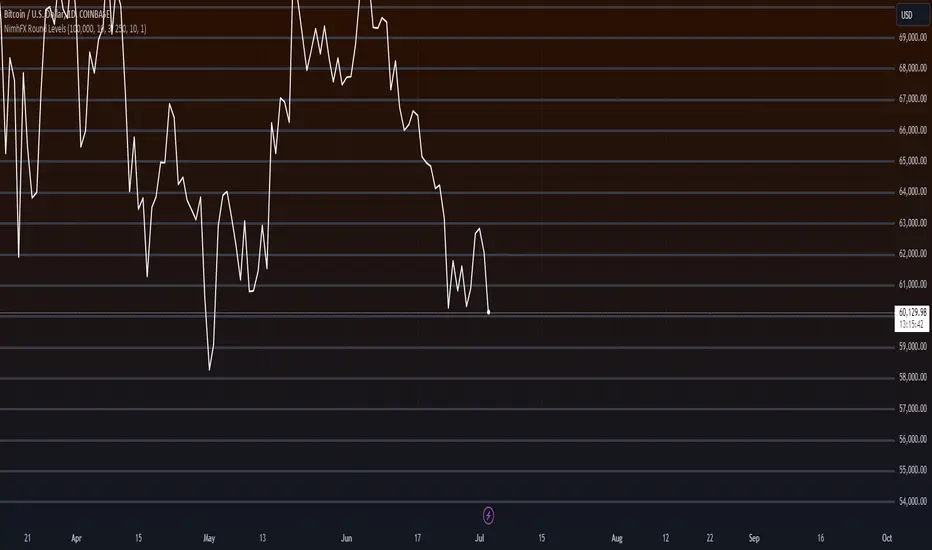
A simple levels indicator for plotting pre-defined price grid.
The default setting is as follows:
Group 1 shows 1000 Point (100 Pip divisions)
Group 2 shows 250 Point (25 Pip divisions)
Groups are duplications of each other to allow multiple divisions to be visible at once, e.g. 100 Pip grid and a 25 pip grid with differing visuals as the default setting.
Number of Lines above/below will alter the amount of lines drawn, change as required, note: Tradingview seems to try to capture all drawings when double-clicking the right price index which can cause this to compress the data.
depending on preferred timeframe you may want to alter this for example to a 10 pip grid (100 point)
版本注释
Updated to work for Crypto - Adjust division values for specific pairs -
BTC - 100000 will produce levels at 60000, 61000 etc
版本注释
Updated受保护脚本
此脚本以闭源形式发布。 但是,您可以自由使用,没有任何限制 — 了解更多信息这里。
免责声明
这些信息和出版物并非旨在提供,也不构成TradingView提供或认可的任何形式的财务、投资、交易或其他类型的建议或推荐。请阅读使用条款了解更多信息。
免责声明
这些信息和出版物并非旨在提供,也不构成TradingView提供或认可的任何形式的财务、投资、交易或其他类型的建议或推荐。请阅读使用条款了解更多信息。