OPEN-SOURCE SCRIPT
已更新 Momentum RSI
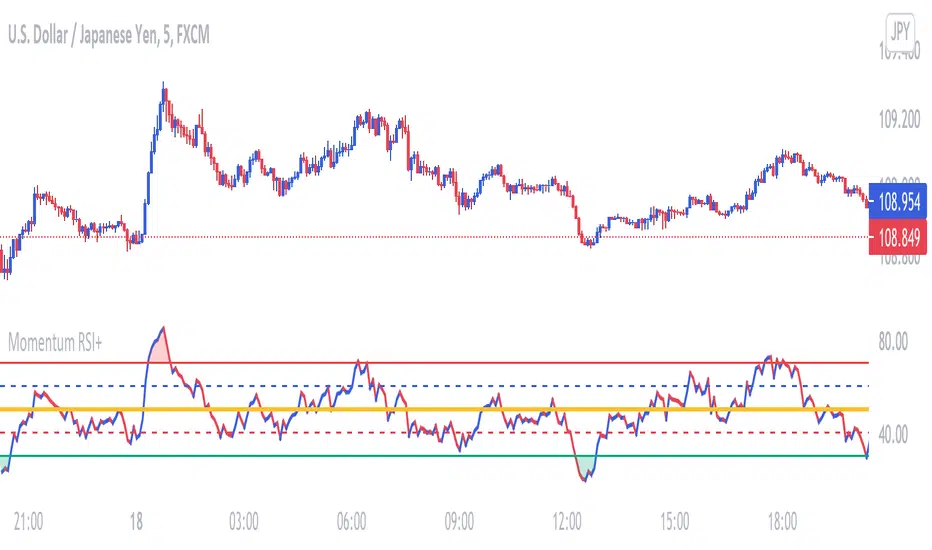
This RSI is used to determine price Momentum and Overbought or Oversold Market conditions. When the RSI is between 50% and 70% price is considered to have upward momentum. When The RSI is between 50% and 30% price is considered to have downward momentum. When the RSI is between 40% and 60% price is considered to have no directional momentum and is considered to be in consolidation. When the RSI is above 70% price is to be considered Overbought. When the RSI is bellow 30% price is to be considered Oversold
版本注释
Renamed Hlines and changed standard color版本注释
Style update版本注释
RSI Line color update to show momentumAdded Green shade when RSI is Overbought and Red shade when RSI is Oversold
开源脚本
本着TradingView的真正精神,此脚本的创建者将其开源,以便交易者可以查看和验证其功能。向作者致敬!虽然您可以免费使用它,但请记住,重新发布代码必须遵守我们的网站规则。
免责声明
这些信息和出版物并不意味着也不构成TradingView提供或认可的金融、投资、交易或其它类型的建议或背书。请在使用条款阅读更多信息。
开源脚本
本着TradingView的真正精神,此脚本的创建者将其开源,以便交易者可以查看和验证其功能。向作者致敬!虽然您可以免费使用它,但请记住,重新发布代码必须遵守我们的网站规则。
免责声明
这些信息和出版物并不意味着也不构成TradingView提供或认可的金融、投资、交易或其它类型的建议或背书。请在使用条款阅读更多信息。