OPEN-SOURCE SCRIPT
已更新 Avg.ROC Table
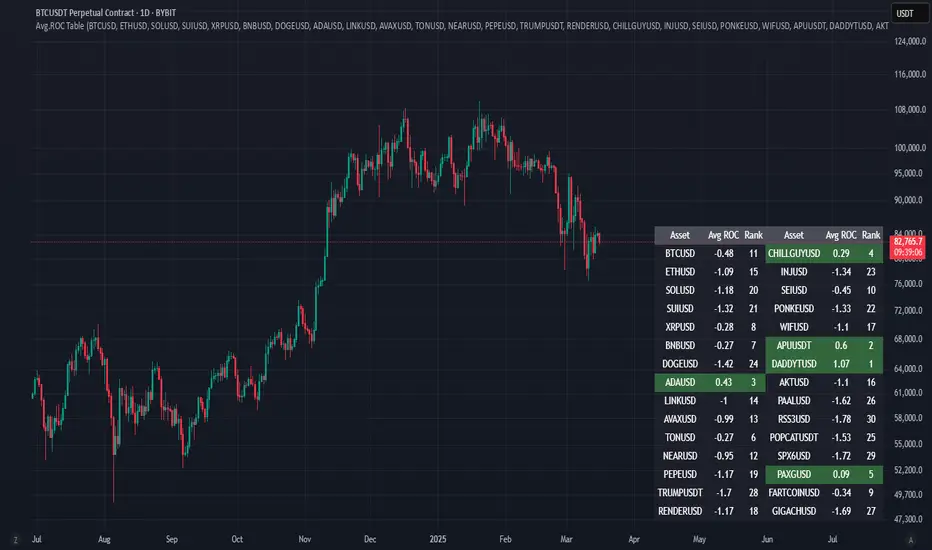
This indicator calculates the average Rate of Change (ROC) for up to 30 user-selected assets over a specified number of candles. It then ranks the assets—assigning rank 1 to the asset with the highest average ROC (strongest momentum) and rank 30 to the asset with the lowest. The results are displayed in a clean, easy-to-read table split into two stacks of 15 assets each, allowing you to quickly see which assets are performing best.
版本注释
This indicator calculates the average Rate of Change (ROC) for up to 30 user-selected assets over a specified number of candles. It then ranks the assets—assigning rank 1 to the asset with the highest average ROC (strongest momentum) and rank 30 to the asset with the lowest. The results are displayed in a clean, easy-to-read table highlighting the top 5 strongest assets, allowing you to quickly see which assets are performing best.
开源脚本
秉承TradingView的精神,该脚本的作者将其开源,以便交易者可以查看和验证其功能。向作者致敬!您可以免费使用该脚本,但请记住,重新发布代码须遵守我们的网站规则。
免责声明
这些信息和出版物并非旨在提供,也不构成TradingView提供或认可的任何形式的财务、投资、交易或其他类型的建议或推荐。请阅读使用条款了解更多信息。
免责声明
这些信息和出版物并非旨在提供,也不构成TradingView提供或认可的任何形式的财务、投资、交易或其他类型的建议或推荐。请阅读使用条款了解更多信息。