OPEN-SOURCE SCRIPT
已更新 TRI - Multi-Timeframe FVG
TRI - MULTI-TIMEFRAME FAIR VALUE GAPS v1.0.0
DESCRIPTION:
Advanced multi-timeframe Fair Value Gap (FVG) indicator that displays FVG zones from higher timeframes
on your current chart. Supports automatic or manual timeframe selection with comprehensive visualization
and alert system.
KEY FEATURES:
HOW IT WORKS:
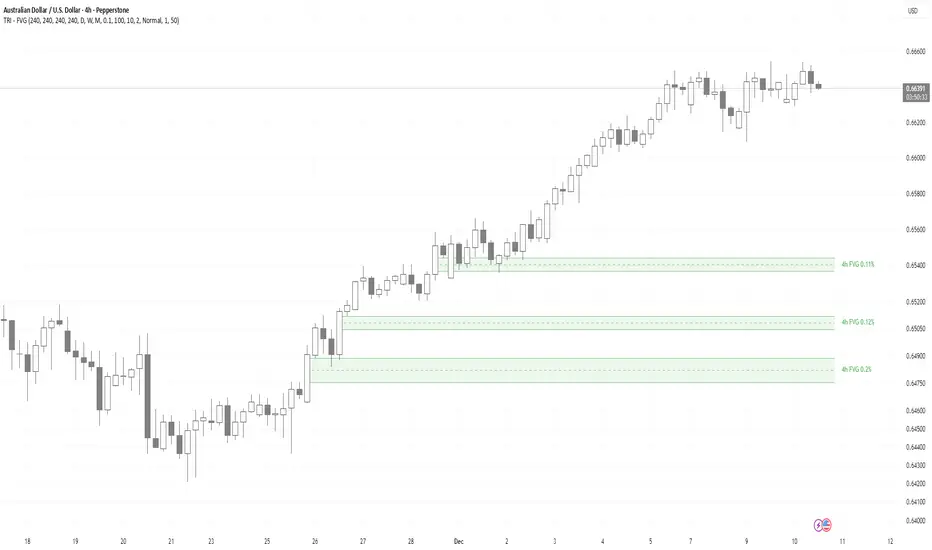
A Fair Value Gap (FVG) is detected when there's a 3-candle pattern with a gap between candle 1 and
candle 3, indicating institutional order flow imbalances. Bullish FVG occurs when candle 3's low is
above candle 1's high (gap up), creating a demand zone shown in green. Bearish FVG occurs when candle
3's high is below candle 1's low (gap down), creating a supply zone shown in red.
The indicator uses request.security() to fetch data from the selected higher timeframe, detects FVG
patterns on that timeframe, and displays them on your current chart. FVG zones remain active until
price closes through them (mitigation), then change color and remain visible for a configurable
number of bars before disappearing.
TIMEFRAME CONFIGURATION:
Configure different FVG timeframes based on current chart timeframe:
All timeframes are configurable via input settings.
BEST USE:
Works on all timeframes and asset classes. Particularly useful for intraday traders who want to see
higher timeframe FVG zones on their lower timeframe charts. FVG zones often act as support/resistance
and are frequently filled by price returning to rebalance the imbalance. Use them to identify potential
entry/exit points, stop-loss placement, and institutional order flow areas.
DESCRIPTION:
Advanced multi-timeframe Fair Value Gap (FVG) indicator that displays FVG zones from higher timeframes
on your current chart. Supports automatic or manual timeframe selection with comprehensive visualization
and alert system.
KEY FEATURES:
- Multi-timeframe FVG detection - view FVG from any higher timeframe
- Automatic timeframe selection - configure different FVG timeframes for each chart timeframe
- Automatic mitigation detection - zones change color when price mitigates them
- Configurable FVG threshold - filter out small gaps
- Customizable visualization - colors, borders, labels, text colors
- Smart zone inclusion - larger zones automatically remove smaller included zones
- Memory efficient - automatic cleanup of expired zones
HOW IT WORKS:
A Fair Value Gap (FVG) is detected when there's a 3-candle pattern with a gap between candle 1 and
candle 3, indicating institutional order flow imbalances. Bullish FVG occurs when candle 3's low is
above candle 1's high (gap up), creating a demand zone shown in green. Bearish FVG occurs when candle
3's high is below candle 1's low (gap down), creating a supply zone shown in red.
The indicator uses request.security() to fetch data from the selected higher timeframe, detects FVG
patterns on that timeframe, and displays them on your current chart. FVG zones remain active until
price closes through them (mitigation), then change color and remain visible for a configurable
number of bars before disappearing.
TIMEFRAME CONFIGURATION:
Configure different FVG timeframes based on current chart timeframe:
- 1m-5m charts → Default 4h FVG
- 15m charts → Default 4h FVG
- 30m-1h charts → Default 4h FVG
- 4h charts → Default 4h FVG
- Daily charts → Default Daily FVG
- Weekly charts → Default Weekly FVG
- Monthly charts → Default Monthly FVG
All timeframes are configurable via input settings.
BEST USE:
Works on all timeframes and asset classes. Particularly useful for intraday traders who want to see
higher timeframe FVG zones on their lower timeframe charts. FVG zones often act as support/resistance
and are frequently filled by price returning to rebalance the imbalance. Use them to identify potential
entry/exit points, stop-loss placement, and institutional order flow areas.
版本注释
TRI - MULTI-TIMEFRAME FAIR VALUE GAPS v1.0.0DESCRIPTION:
Advanced multi-timeframe Fair Value Gap (FVG) indicator that displays FVG zones from higher timeframes
on your current chart. Supports automatic or manual timeframe selection with comprehensive visualization
and alert system.
KEY FEATURES:
- Multi-timeframe FVG detection - view FVG from any higher timeframe
- Automatic timeframe selection - configure different FVG timeframes for each chart timeframe
- Automatic mitigation detection - zones change color when price mitigates them
- Configurable FVG threshold - filter out small gaps
- Customizable visualization - colors, borders, labels, text colors
- Smart zone inclusion - larger zones automatically remove smaller included zones
- Memory efficient - automatic cleanup of expired zones
HOW IT WORKS:
A Fair Value Gap (FVG) is detected when there's a 3-candle pattern with a gap between candle 1 and
candle 3, indicating institutional order flow imbalances. Bullish FVG occurs when candle 3's low is
above candle 1's high (gap up), creating a demand zone shown in green. Bearish FVG occurs when candle
3's high is below candle 1's low (gap down), creating a supply zone shown in red.
The indicator uses request.security() to fetch data from the selected higher timeframe, detects FVG
patterns on that timeframe, and displays them on your current chart. FVG zones remain active until
price closes through them (mitigation), then change color and remain visible for a configurable
number of bars before disappearing.
TIMEFRAME CONFIGURATION:
Configure different FVG timeframes based on current chart timeframe:
- 1m-5m charts → Default 4h FVG
- 15m charts → Default 4h FVG
- 30m-1h charts → Default 4h FVG
- 4h charts → Default 4h FVG
- Daily charts → Default Daily FVG
- Weekly charts → Default Weekly FVG
- Monthly charts → Default Monthly FVG
All timeframes are configurable via input settings.
BEST USE:
Works on all timeframes and asset classes. Particularly useful for intraday traders who want to see
higher timeframe FVG zones on their lower timeframe charts. FVG zones often act as support/resistance
and are frequently filled by price returning to rebalance the imbalance. Use them to identify potential
entry/exit points, stop-loss placement, and institutional order flow areas.
开源脚本
秉承TradingView的精神,该脚本的作者将其开源,以便交易者可以查看和验证其功能。向作者致敬!您可以免费使用该脚本,但请记住,重新发布代码须遵守我们的网站规则。
免责声明
这些信息和出版物并非旨在提供,也不构成TradingView提供或认可的任何形式的财务、投资、交易或其他类型的建议或推荐。请阅读使用条款了解更多信息。
开源脚本
秉承TradingView的精神,该脚本的作者将其开源,以便交易者可以查看和验证其功能。向作者致敬!您可以免费使用该脚本,但请记住,重新发布代码须遵守我们的网站规则。
免责声明
这些信息和出版物并非旨在提供,也不构成TradingView提供或认可的任何形式的财务、投资、交易或其他类型的建议或推荐。请阅读使用条款了解更多信息。