PROTECTED SOURCE SCRIPT
TS & AO
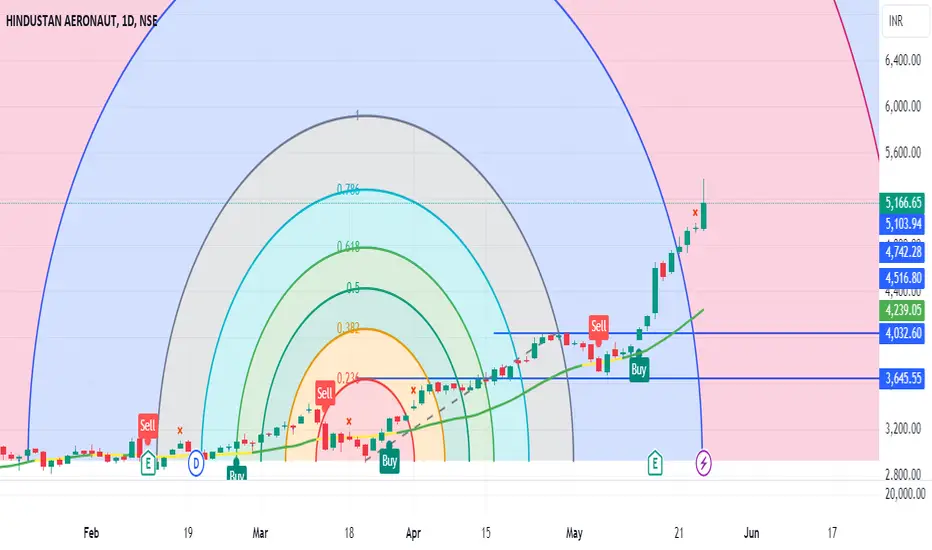
This is Best Intraday and Swing Trading Indicator
Certainly! Let’s explore some intraday and swing trading indicators that can help traders make informed decisions
SuperTrend:
The Supertrend indicator is commonly used for intraday trading.
It is plotted on the price chart and helps determine the current trend.
Parameters: It uses the Average True Range (ATR) with default values of 10 for the period and 3 for the multiplier.
Interpretation:
Upward trend: When Supertrend is below the bars and changes color to green, it indicates a buy signal.
Downward trend: When Supertrend is above the bars and turns red, it signals a sell opportunity1.
VWAP (Volume Weighted Average Price):
VWAP is a volume-based indicator.
It compares the value of a stock traded at a specific time to the total volume traded for that stock.
Interpretation:
Bullish trend: When the stock price is above VWAP, it suggests an uptrend.
Traders can consider buying on retracements toward VWAP in the direction of the trend1.
Moving Averages (MAs):
MAs are versatile indicators suitable for intraday, swing, and longer-term trading.
Common MAs include:
9-day MA: Short-term trend indicator.
50-day MA: Intermediate trend indicator.
100-day MA: Longer-term trend indicator.
Interpretation:
Uptrend: When the stock price is above the MA, it signals a bullish trend.
Downtrend: When the price is below the MA, it suggests a bearish trend2.
受保护脚本
此脚本以闭源形式发布。 但是,您可以自由使用,没有任何限制 — 了解更多信息这里。
免责声明
这些信息和出版物并非旨在提供,也不构成TradingView提供或认可的任何形式的财务、投资、交易或其他类型的建议或推荐。请阅读使用条款了解更多信息。
受保护脚本
此脚本以闭源形式发布。 但是,您可以自由使用,没有任何限制 — 了解更多信息这里。
免责声明
这些信息和出版物并非旨在提供,也不构成TradingView提供或认可的任何形式的财务、投资、交易或其他类型的建议或推荐。请阅读使用条款了解更多信息。