OPEN-SOURCE SCRIPT
yats
This is a helper indicator for "yats" (Yet Another Trading Strategy).
This is a grouping of several indicators in one to help with a very basic trend following strategy. In order to utilize this indicator, it is best to have your chart set to a Line chart.
How to use:
This is a basic trend strategy in which the trader will enter or reverse their position on the break of the trend.
With the chart set to line and the source set to close, a basic line with peaks and valleys is displayed.
When the line peaks, then retreats, this is a potential setup for a long position. The trader is to wait for a valley (lower point) to be formed and then for the previous peak to be broken.
The timeframe continuity labels in the lower right of the chart help to ensure the position taken is in line with the higher timeframe trend.
Example scenario (long):
Chart is set to 1H timeframe. Timeframe continuity indicator will have labels for 1H, 4H, Day, WK, MN, and QTR. Chart shows a peak at a close price of 5 then the next bar sets a valley at a close price of 4.
Next bar forms and sets a close price of 6. Timeframe continuity labels are green for 1H, 4H, Day, and WK. (At least three higher timeframes should match the direction of the desired trade.)
This is a signal to go long as the previous peak was broken and timeframe continuity is in the direction
of the trade (long). Initial conservative stoploss should be placed at the previous valley (4). A wider stoploss could be placed at the low created when the close was 4. This is made visible by the default red line
when Candle Highs and Lows plots are turned on. Stoploss is then trailed up either by each subsequent higher low, OR with each subsequent dip as price moves higher.
A target can be set, but is not an integral part of this strategy.
Features:
Full Timeframe Continuity:
In the lower right corner of the chart will be indicators for timeframes greater than or equal to the chart timeframe.
Each one will be Red, Green, or White to indicate down, up, or flat. This provides you with the direction of the higher timeframes in real time, before the bar has closed.
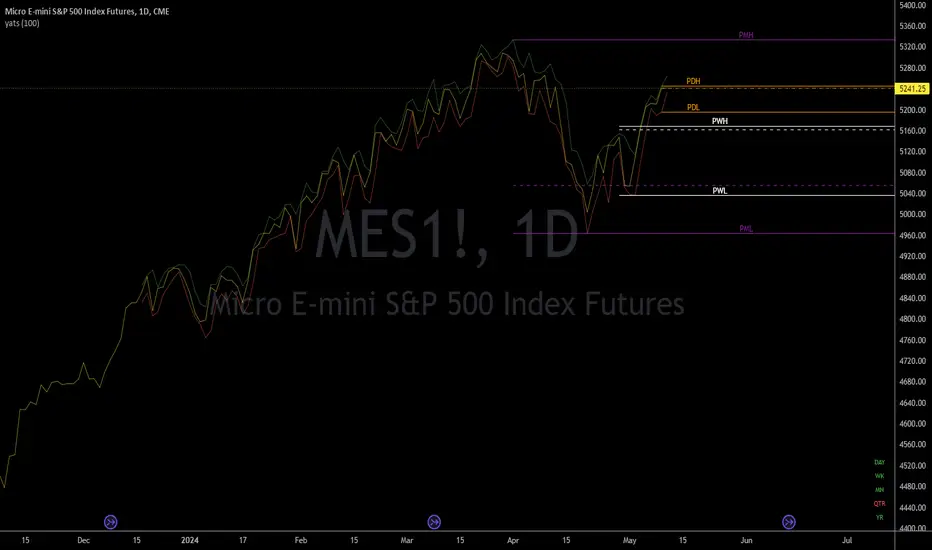
Potential Support/Resistance Points:
The indicator plots horizontal rays for the previous Day, Week, and Month for the High, Low, and Close. Day = Orange, Week = White, Month = Purple. High and Low are solid lines while Close is a dashed line.
This provides the trader with potential pivot points based on higher timeframe high, low, and close prices. The horizontal rays will automatically move to the right at the start of the newest day, week, or month.
Candle Highs and Lows:
Since the chart should be set to Line instead of Candles or Bars, this indicator provides plots that follow the Highs (Green) and Lows (Red) of each 'bar' of the chart timeframe. This has been made configurable
so these lines can be turned off or edited in the settings for those who do not want them on the chart or just want them to look different.
This is a grouping of several indicators in one to help with a very basic trend following strategy. In order to utilize this indicator, it is best to have your chart set to a Line chart.
How to use:
This is a basic trend strategy in which the trader will enter or reverse their position on the break of the trend.
With the chart set to line and the source set to close, a basic line with peaks and valleys is displayed.
When the line peaks, then retreats, this is a potential setup for a long position. The trader is to wait for a valley (lower point) to be formed and then for the previous peak to be broken.
The timeframe continuity labels in the lower right of the chart help to ensure the position taken is in line with the higher timeframe trend.
Example scenario (long):
Chart is set to 1H timeframe. Timeframe continuity indicator will have labels for 1H, 4H, Day, WK, MN, and QTR. Chart shows a peak at a close price of 5 then the next bar sets a valley at a close price of 4.
Next bar forms and sets a close price of 6. Timeframe continuity labels are green for 1H, 4H, Day, and WK. (At least three higher timeframes should match the direction of the desired trade.)
This is a signal to go long as the previous peak was broken and timeframe continuity is in the direction
of the trade (long). Initial conservative stoploss should be placed at the previous valley (4). A wider stoploss could be placed at the low created when the close was 4. This is made visible by the default red line
when Candle Highs and Lows plots are turned on. Stoploss is then trailed up either by each subsequent higher low, OR with each subsequent dip as price moves higher.
A target can be set, but is not an integral part of this strategy.
Features:
Full Timeframe Continuity:
In the lower right corner of the chart will be indicators for timeframes greater than or equal to the chart timeframe.
Each one will be Red, Green, or White to indicate down, up, or flat. This provides you with the direction of the higher timeframes in real time, before the bar has closed.
Potential Support/Resistance Points:
The indicator plots horizontal rays for the previous Day, Week, and Month for the High, Low, and Close. Day = Orange, Week = White, Month = Purple. High and Low are solid lines while Close is a dashed line.
This provides the trader with potential pivot points based on higher timeframe high, low, and close prices. The horizontal rays will automatically move to the right at the start of the newest day, week, or month.
Candle Highs and Lows:
Since the chart should be set to Line instead of Candles or Bars, this indicator provides plots that follow the Highs (Green) and Lows (Red) of each 'bar' of the chart timeframe. This has been made configurable
so these lines can be turned off or edited in the settings for those who do not want them on the chart or just want them to look different.
开源脚本
秉承TradingView的精神,该脚本的作者将其开源,以便交易者可以查看和验证其功能。向作者致敬!您可以免费使用该脚本,但请记住,重新发布代码须遵守我们的网站规则。
免责声明
这些信息和出版物并非旨在提供,也不构成TradingView提供或认可的任何形式的财务、投资、交易或其他类型的建议或推荐。请阅读使用条款了解更多信息。
开源脚本
秉承TradingView的精神,该脚本的作者将其开源,以便交易者可以查看和验证其功能。向作者致敬!您可以免费使用该脚本,但请记住,重新发布代码须遵守我们的网站规则。
免责声明
这些信息和出版物并非旨在提供,也不构成TradingView提供或认可的任何形式的财务、投资、交易或其他类型的建议或推荐。请阅读使用条款了解更多信息。