OPEN-SOURCE SCRIPT
已更新 Low and High Values [Alorse]
🌟 What does this indicator do?
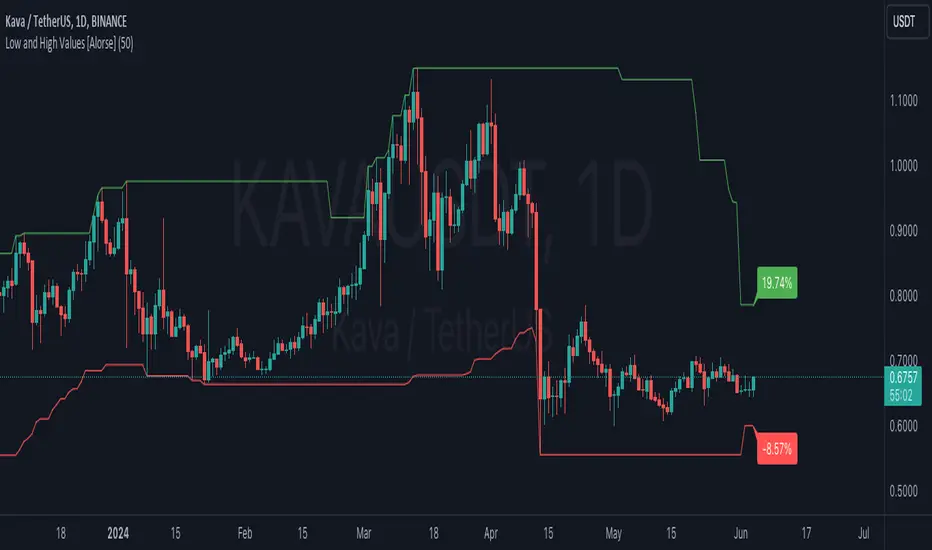
This magical indicator shows you the lowest (Low) and highest (High) values of the last X candles directly on your chart. Not only that, but it also tells you how much the price has changed from the opening price of the current candle to these key points, all in percentage format. You'll have a clear and precise view of market movement!
🔧 Customize to your liking
Want to adjust the number of candles to consider? No problem! You can easily change this parameter to suit your preference. Whether you like short-term strategies with just a few candles or prefer more extensive analysis with many candles, our indicator adapts to you.
🚀 How can this indicator help you?
📊 Examples of Use
🛠️ Customizable Parameters
This magical indicator shows you the lowest (Low) and highest (High) values of the last X candles directly on your chart. Not only that, but it also tells you how much the price has changed from the opening price of the current candle to these key points, all in percentage format. You'll have a clear and precise view of market movement!
🔧 Customize to your liking
Want to adjust the number of candles to consider? No problem! You can easily change this parameter to suit your preference. Whether you like short-term strategies with just a few candles or prefer more extensive analysis with many candles, our indicator adapts to you.
🚀 How can this indicator help you?
- Identify Support and Resistance: By showing the lowest and highest points, it helps you identify key support and resistance levels. Perfect for planning your entries and exits!
- Trend Analysis: With the percentage labels, you can quickly see how the price has moved relative to recent extremes, helping you confirm trends or anticipate possible reversals.
- Trading Strategies: Imagine the price is near a recent low, but the percentage indicates a significant drop from the opening. This could be a buy signal if you expect a rebound. Conversely, if the price is near a recent high with a large percentage increase, you might consider selling.
- Calculate Stop Loss: Use this indicator to determine your Stop Loss levels by leaving a bit of margin between the indicator value and your desired SL. This helps protect your positions while allowing for some price fluctuation.
📊 Examples of Use
- Intraday Trader: Use the indicator with 10-20 candles to capture quick moves and capitalize on daily fluctuations.
- Mid-term Trader: Set the indicator to consider 50 candles for a broader view of trends and reversal points.
- Long-term Strategist: Adjust the indicator to 100 candles or more to identify highs and lows over larger time frames.
🛠️ Customizable Parameters
- Number of Candles: Define the number of candles the indicator will analyze to calculate the lowest and highest values. It's all up to you!
版本注释
🌟 What does this indicator do?Our magical indicator shows you the lowest (Low) and highest (High) values of the last X candles directly on your chart. Not only that, but it also tells you how much the price has changed from the opening price of the current candle to these key points, all in percentage format. You'll have a clear and precise view of market movement!
🔧 Customize to your liking
Want to adjust the number of candles to consider? No problem! You can easily change this parameter to suit your preference. Whether you like short-term strategies with just a few candles or prefer more extensive analysis with many candles, our indicator adapts to you.
🚀 How can this indicator help you?
- Identify Support and Resistance: By showing the lowest and highest points, it helps you identify key support and resistance levels. Perfect for planning your entries and exits!
- Trend Analysis: With the percentage labels, you can quickly see how the price has moved relative to recent extremes, helping you confirm trends or anticipate possible reversals.
- Trading Strategies: Imagine the price is near a recent low, but the percentage indicates a significant drop from the opening. This could be a buy signal if you expect a rebound. Conversely, if the price is near a recent high with a large percentage increase, you might consider selling.
- Calculate Stop Loss: Use this indicator to determine your Stop Loss levels by leaving a bit of margin between the indicator value and your desired SL. This helps protect your positions while allowing for some price fluctuation.
- Tooltips for Precision: Now with added tooltips on the labels, you can hover your mouse over the percentage labels to see the exact price value at that point. This provides an extra layer of precision for your analysis and decision-making.
📊 Examples of Use
- Intraday Trader: Use the indicator with 10-20 candles to capture quick moves and capitalize on daily fluctuations.
- Mid-term Trader: Set the indicator to consider 50 candles for a broader view of trends and reversal points.
- Long-term Strategist: Adjust the indicator to 100 candles or more to identify highs and lows over larger time frames.
🛠️ Customizable Parameters
- Number of Candles: Define the number of candles the indicator will analyze to calculate the lowest and highest values. It's all up to you!
📋 Clean and Clear Chart
To enhance your trading experience, we've also eliminated other indicators from the chart in this version. This ensures a clutter-free, easy-to-read display focused solely on the crucial low and high values.
开源脚本
秉承TradingView的精神,该脚本的作者将其开源,以便交易者可以查看和验证其功能。向作者致敬!您可以免费使用该脚本,但请记住,重新发布代码须遵守我们的网站规则。
免责声明
这些信息和出版物并非旨在提供,也不构成TradingView提供或认可的任何形式的财务、投资、交易或其他类型的建议或推荐。请阅读使用条款了解更多信息。
免责声明
这些信息和出版物并非旨在提供,也不构成TradingView提供或认可的任何形式的财务、投资、交易或其他类型的建议或推荐。请阅读使用条款了解更多信息。